added titles to figures
Source Link

I am working on a research project to identify the individual impact of dominant personalities, and sexual esteem on sadistic behavior. I am also completely new to statistical analysis.

Both of my independent and dependent variables have been measured using standard questionnaires used in the field of research. The independent variables are measured using a 5 point and 4 point Likert scale. The dependent variable is measured using a questionnaire with yes/no items scored with 1/0 respectively. (max score of 20) Each item is assigned a numerical value and the responses are summed to get the scores for each scale.

When I started analyzing the data, I realized that my dependent variable violates most of the linear regression assumptions and is bounded at 0 with a lot of near zero values. Linear regression results proved to be pretty meaningless.

On further analysis of my dependent variable, I realized that the sadism scale is essentially measuring a count of the questions answered positively. (An example question: Has imagining that you or someone else were causing pain to somebody ever excited you sexually?) and to me, this fits well for something like a negative binomial regression model which is used for modeling count variables. Is this a viable approach for me to explore for my problem?

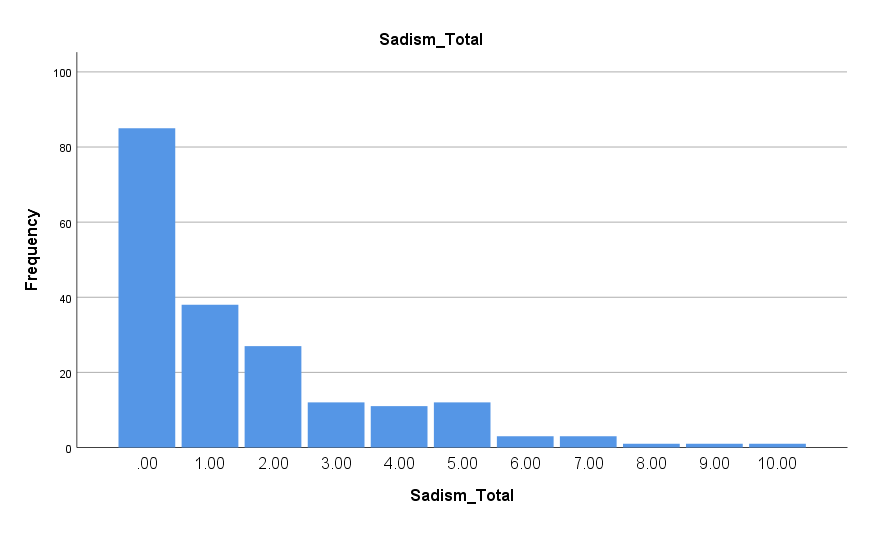
Frequency distribution of the dependent variable

   enter image description hereFrequency distribution of the dependent variable

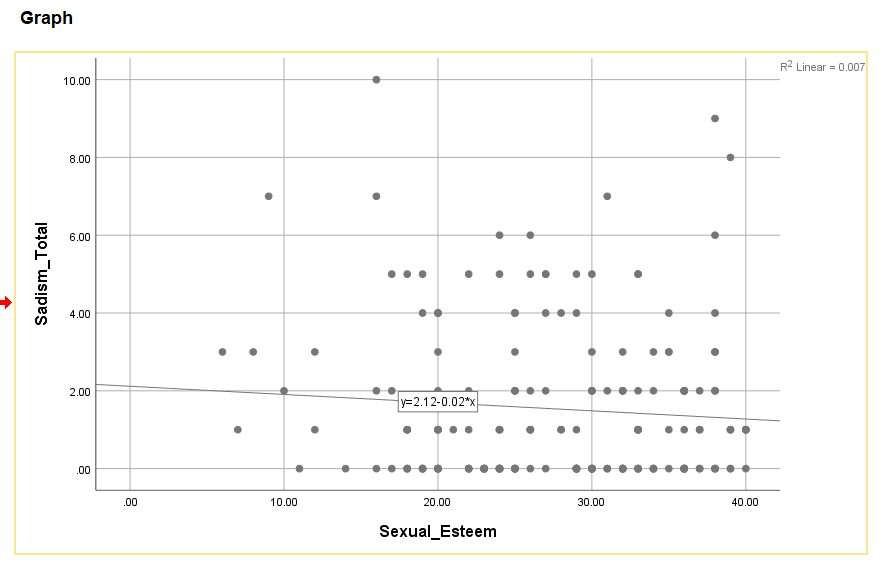
   Scatter plot of IV vs DV

enter image description here Scatter plot of IV vs DV

I am working on a research project to identify the individual impact of dominant personalities, and sexual esteem on sadistic behavior. I am also completely new to statistical analysis.

Both of my independent and dependent variables have been measured using standard questionnaires used in the field of research. The independent variables are measured using a 5 point and 4 point Likert scale. The dependent variable is measured using a questionnaire with yes/no items scored with 1/0 respectively. (max score of 20) Each item is assigned a numerical value and the responses are summed to get the scores for each scale.

When I started analyzing the data, I realized that my dependent variable violates most of the linear regression assumptions and is bounded at 0 with a lot of near zero values. Linear regression results proved to be pretty meaningless.

On further analysis of my dependent variable, I realized that the sadism scale is essentially measuring a count of the questions answered positively. (An example question: Has imagining that you or someone else were causing pain to somebody ever excited you sexually?) and to me, this fits well for something like a negative binomial regression model which is used for modeling count variables. Is this a viable approach for me to explore for my problem?

Frequency distribution of the dependent variable

 enter image description here

 Scatter plot of IV vs DV

enter image description here

I am working on a research project to identify the individual impact of dominant personalities, and sexual esteem on sadistic behavior. I am also completely new to statistical analysis.

Both of my independent and dependent variables have been measured using standard questionnaires used in the field of research. The independent variables are measured using a 5 point and 4 point Likert scale. The dependent variable is measured using a questionnaire with yes/no items scored with 1/0 respectively. (max score of 20) Each item is assigned a numerical value and the responses are summed to get the scores for each scale.

When I started analyzing the data, I realized that my dependent variable violates most of the linear regression assumptions and is bounded at 0 with a lot of near zero values. Linear regression results proved to be pretty meaningless.

On further analysis of my dependent variable, I realized that the sadism scale is essentially measuring a count of the questions answered positively. (An example question: Has imagining that you or someone else were causing pain to somebody ever excited you sexually?) and to me, this fits well for something like a negative binomial regression model which is used for modeling count variables. Is this a viable approach for me to explore for my problem?

Frequency distribution of the dependent variable  Frequency distribution of the dependent variable  Scatter plot of IV vs DV Scatter plot of IV vs DV
added a scatter plot describing IV vs DV
Source Link

I am working on a research project to identify the individual impact of dominant personalities, and sexual esteem on sadistic behavior. I am also completely new to statistical analysis.

Both of my independent and dependent variables have been measured using standard questionnaires used in the field of research. The independent variables are measured using a 5 point and 4 point Likert scale. The dependent variable is measured using a questionnaire with yes/no items scored with 1/0 respectively. (max score of 20) Each item is assigned a numerical value and the responses are summed to get the scores for each scale.

When I started analyzing the data, I realized that my dependent variable violates most of the linear regression assumptions and is bounded at 0 with a lot of near zero values. Linear regression results proved to be pretty meaningless.

On further analysis of my dependent variable, I realized that the sadism scale is essentially measuring a count of the questions answered positively. (An example question: Has imagining that you or someone else were causing pain to somebody ever excited you sexually?) and to me, this fits well for something like a negative binomial regression model which is used for modeling count variables. Is this a viable approach for me to explore for my problem?

Frequency distribution of the dependent variable

enter image description here

Scatter plot of IV vs DV

enter image description here

I am working on a research project to identify the individual impact of dominant personalities, and sexual esteem on sadistic behavior. I am also completely new to statistical analysis.

Both of my independent and dependent variables have been measured using standard questionnaires used in the field of research. The independent variables are measured using a 5 point and 4 point Likert scale. The dependent variable is measured using a questionnaire with yes/no items scored with 1/0 respectively. (max score of 20) Each item is assigned a numerical value and the responses are summed to get the scores for each scale.

When I started analyzing the data, I realized that my dependent variable violates most of the linear regression assumptions and is bounded at 0 with a lot of near zero values. Linear regression results proved to be pretty meaningless.

On further analysis of my dependent variable, I realized that the sadism scale is essentially measuring a count of the questions answered positively. (An example question: Has imagining that you or someone else were causing pain to somebody ever excited you sexually?) and to me, this fits well for something like a negative binomial regression model which is used for modeling count variables. Is this a viable approach for me to explore for my problem?

Frequency distribution of the dependent variable

enter image description here

Scatter plot of IV vs DV

enter image description here

Source Link

Can I model my analysis as a negative binomial regression problem?

I am working on a research project to identify the individual impact of dominant personalities, and sexual esteem on sadistic behavior. I am also completely new to statistical analysis.

Both of my independent and dependent variables have been measured using standard questionnaires used in the field of research. The independent variables are measured using a 5 point and 4 point Likert scale. The dependent variable is measured using a questionnaire with yes/no items scored with 1/0 respectively. (max score of 20) Each item is assigned a numerical value and the responses are summed to get the scores for each scale.

When I started analyzing the data, I realized that my dependent variable violates most of the linear regression assumptions and is bounded at 0 with a lot of near zero values. Linear regression results proved to be pretty meaningless.

On further analysis of my dependent variable, I realized that the sadism scale is essentially measuring a count of the questions answered positively. (An example question: Has imagining that you or someone else were causing pain to somebody ever excited you sexually?) and to me, this fits well for something like a negative binomial regression model which is used for modeling count variables. Is this a viable approach for me to explore for my problem?

Frequency distribution of the dependent variable

enter image description here