Edit:
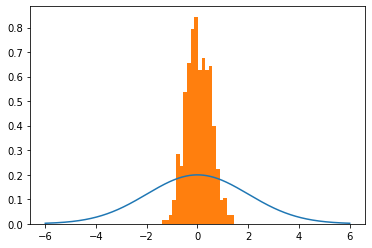
I've implemented in some code based on my understanding of the algorithm. It works for a gaussian with mu=0, sigma=1. But if I change sigma it breaks. Any insights would be appreciated.
import numpy as np
import random
import scipy.stats as st
import matplotlib.pyplot as plt
from autograd import grad

def normal(x,mu,sigma):
    numerator = np.exp((-(x-mu)**2)/(2*sigma**2))
    denominator = sigma * np.sqrt(2*np.pi)
    return numerator/denominator

def neg_log_prob(x,mu,sigma):
    num = np.exp(-1*((x-mu)**2)/2*sigma**2)
    den = sigma*np.sqrt(np.pi*2)
    return -1*np.log(num/den)

def HMC(mu=0.0,sigma=1.0,path_len=1,step_size=0.25,initial_position=0.0,epochs=1_000):
    # setup
    steps = int(path_len/step_size) -1 # path_len and step_size are tricky parameters to tune...
    samples = [initial_position]
    momentum_dist = st.norm(0, 1)
    # generate samples
    for e in range(epochs):
        q0 = np.copy(samples[-1])
        q1 = np.copy(q0)
        p0 = momentum_dist.rvs()
        p1 = np.copy(p0)
        dVdQ = -1*(q0-mu)/(sigma**2) # gradient of PDF wrt position (q0) aka momentum wrt position

        # leapfrog integration begin
        for s in range(steps):
            p1 += step_size*dVdQ/2 # as potential energy increases, kinetic energy decreases
            q1 += step_size*p1 # position increases as function of momentum
            p1 += step_size*dVdQ/2 # second half "leapfrog" update to momentum
        # leapfrog integration end
        p1 = -1*p1 #flip momentum for reversibility

        #metropolis acceptance
        q0_nlp = neg_log_prob(x=q0,mu=mu,sigma=sigma)
        q1_nlp = neg_log_prob(x=q1,mu=mu,sigma=sigma)

        p0_nlp = neg_log_prob(x=p0,mu=0,sigma=1)
        p1_nlp = neg_log_prob(x=p1,mu=0,sigma=1)

        # Account for negatives AND log(probabiltiies)...
        target = q0_nlp - q1_nlp # P(q1)/P(q0)
        adjustment = p1_nlp - p0_nlp # P(p1)/P(p0)
        acceptance = target + adjustment

        event = np.log(random.uniform(0,1))
        if event <= acceptance:
            samples.append(q1)
        else:
            samples.append(q0)

    return samples
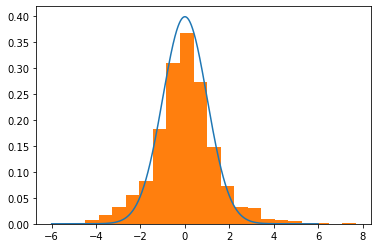
Now it works here:
mu, sigma = 0,1
trial = HMC(mu=mu,sigma=sigma,path_len=2,step_size=0.25)

# What the dist should looks like
lines = np.linspace(-6,6,10_000)
normal_curve = [normal(x=l,mu=mu,sigma=sigma) for l in lines]

# Visualize
plt.plot(lines,normal_curve)
plt.hist(trial,density=True,bins=20)
plt.show()
But it breaks when I change sigma to 2.
# Generate samples
mu, sigma = 0,2
trial = HMC(mu=mu,sigma=sigma,path_len=2,step_size=0.25)

# What the dist should looks like
lines = np.linspace(-6,6,10_000)
normal_curve = [normal(x=l,mu=mu,sigma=sigma) for l in lines]

# Visualize
plt.plot(lines,normal_curve)
plt.hist(trial,density=True,bins=20)
plt.show()
Any ideas? I feel like I'm close to "getting it".


