Tweeted twitter.com/StackStats/status/1402505741865476099
Post Reopened by Sycorax
I clarified the questions and provided enough details that the reader no longer needs to watch the video.
Source Link

Steve Mould explained very briefly how he used his wife's contractionsuses contraction data to predict the delivery time of birth of their sonhis child [1]. Unfortunately the details from his presentation are sparse:

They are not very predictable. They're quite spread out, but as time goes on it gets more predictable - it's more bunched up there. And there's a wonderful thing you can do with excel. You can track how that changes as a function of time. Is the standard deviation basically. So I was able to create sort of an envelope of possible contraction lengths and then project that into the future. [...] there is point in the future at which my wife's contractions become perfectly regular and that's at 20:55. And it's my working hypothesis that that is the moment my child will be born [2].

https://www.youtube.com/watch?v=k7q0Y2W0Rn4 Questions:

  1. How did Steve Mould calculate the lower and upper bound lines? I cannot figure out how to track how predictable the random variable is becoming. Is it just just confidence interval using the last 10 points?
  2. How does Steve extrapolate the lines and predict?
  3. How is the intersection of the extrapolated lines calculated?

enter image description hereSteve Mould shows contract data and his extrapolation that predicts the delivery time

Does anyone know how he approximated the upper and lower bound lines and how he predicted the intersection?

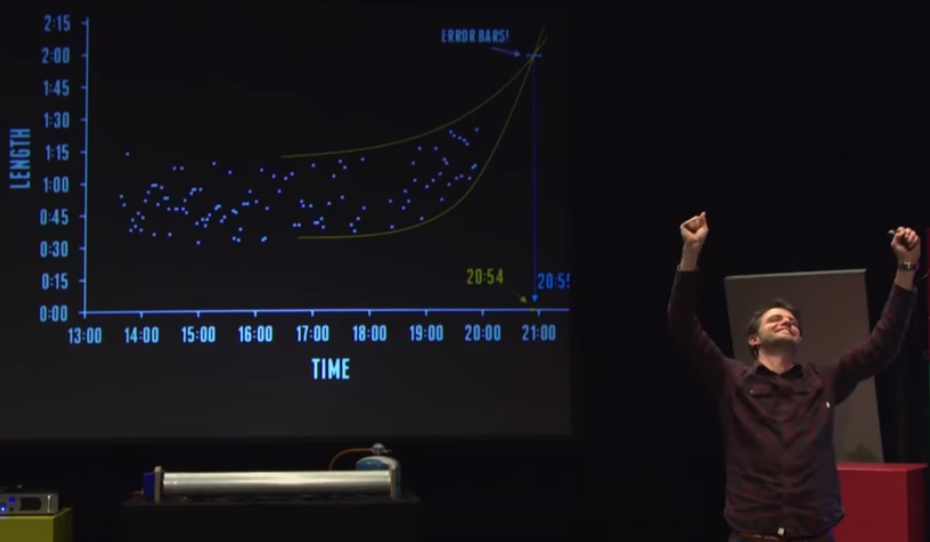
Steve Mould explained very briefly how he used his wife's contractions data to predict the time of birth of their son:

https://www.youtube.com/watch?v=k7q0Y2W0Rn4

enter image description here

Does anyone know how he approximated the upper and lower bound lines and how he predicted the intersection?

Steve Mould uses contraction data to predict the delivery time of his child [1]. Unfortunately the details from his presentation are sparse:

They are not very predictable. They're quite spread out, but as time goes on it gets more predictable - it's more bunched up there. And there's a wonderful thing you can do with excel. You can track how that changes as a function of time. Is the standard deviation basically. So I was able to create sort of an envelope of possible contraction lengths and then project that into the future. [...] there is point in the future at which my wife's contractions become perfectly regular and that's at 20:55. And it's my working hypothesis that that is the moment my child will be born [2].

Questions:

  1. How did Steve Mould calculate the lower and upper bound lines? I cannot figure out how to track how predictable the random variable is becoming. Is it just just confidence interval using the last 10 points?
  2. How does Steve extrapolate the lines and predict?
  3. How is the intersection of the extrapolated lines calculated?

Steve Mould shows contract data and his extrapolation that predicts the delivery time

What methods How did Steve Mould use to predict his child birth time with contraction duration over time?

Steve Mould explained very briefly how he used his wife's contractions data to predict the time of birth of their son:

https://www.youtube.com/watch?v=k7q0Y2W0Rn4

enter image description here

He quickly mentions "standard deviations", but I guess there is something more involved, especially forDoes anyone know how he approximated the prediction of regular contractions (the crossing of upper and lower bounds).

I'm fine with the data collection (just use the app he suggest), but what methods didbound lines and how he probably use to analyze thempredicted the intersection?

What methods did Steve Mould use to predict his child birth time?

Steve Mould explained very briefly how he used his wife's contractions data to predict the time of birth of their son:

https://www.youtube.com/watch?v=k7q0Y2W0Rn4

enter image description here

He quickly mentions "standard deviations", but I guess there is something more involved, especially for the prediction of regular contractions (the crossing of upper and lower bounds).

I'm fine with the data collection (just use the app he suggest), but what methods did he probably use to analyze them?

How did Steve Mould predict his child birth time with contraction duration over time?

Steve Mould explained very briefly how he used his wife's contractions data to predict the time of birth of their son:

https://www.youtube.com/watch?v=k7q0Y2W0Rn4

enter image description here

Does anyone know how he approximated the upper and lower bound lines and how he predicted the intersection?

Post Closed as "Needs details or clarity" by Xi'an, kjetil b halvorsen, mdewey, steffen, jpmuc
Source Link

What methods did Steve Mould use to predict his child birth time?

Steve Mould explained very briefly how he used his wife's contractions data to predict the time of birth of their son:

https://www.youtube.com/watch?v=k7q0Y2W0Rn4

enter image description here

He quickly mentions "standard deviations", but I guess there is something more involved, especially for the prediction of regular contractions (the crossing of upper and lower bounds).

I'm fine with the data collection (just use the app he suggest), but what methods did he probably use to analyze them?