Bumped by Community user
Post Reopened by Karolis Koncevičius, kjetil b halvorsen
deleted 28 characters in body
Source Link

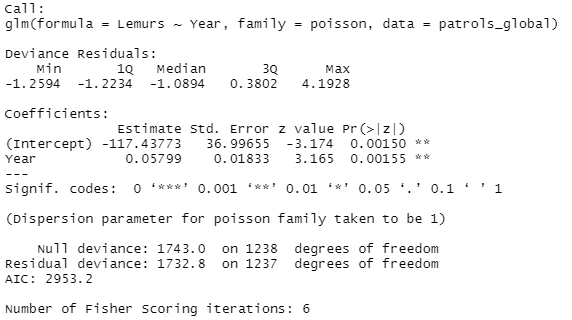
I ran a glm looking at population changes over years, and am unsure which results I need to include for a poster presentation. I understand the p value is important for significance but other than that what numbers are necessary and how would I report them?   

enter image description hereimg edit** 

I do not completely understand what each of the values mean. I am trying to show how populations have changed over the years. I am trying to say something in a university poster along the lines of "I found there to be an overall increase in the population from 2015-2021 (p=0.00155)" but I'm unsure what else would go in the brackets.

I ran a glm looking at population changes over years, and am unsure which results I need to include for a poster presentation. I understand the p value is important for significance but other than that what numbers are necessary and how would I report them?  enter image description here edit** I do not completely understand what each of the values mean. I am trying to show how populations have changed over the years. I am trying to say something in a university poster along the lines of "I found there to be an overall increase in the population from 2015-2021 (p=0.00155)" but I'm unsure what else would go in the brackets.

I ran a glm looking at population changes over years, and am unsure which results I need to include for a poster presentation. I understand the p value is important for significance but other than that what numbers are necessary and how would I report them? 

img 

I do not completely understand what each of the values mean. I am trying to show how populations have changed over the years. I am trying to say something in a university poster along the lines of "I found there to be an overall increase in the population from 2015-2021 (p=0.00155)" but I'm unsure what else would go in the brackets.

added 216 characters in body
Added to review
Source Link
Alex
  • 11
  • 1
  • 3

I ran a glm looking at population changes over years, and am unsure which results I need to include for a poster presentation. I understand the p value is important for significance but other than that what numbers are necessary and how would I report them? enter image description here edit** I do not completely understand what each of the values mean. I am trying to show how populations have changed over the years. I am trying to say something in a university poster along the lines of "I found there to be an overall increase in the population from 2015-2021 (p=0.00155)" but I'm unsure what else would go in the brackets.

I ran a glm looking at population changes over years, and am unsure which results I need to include for a poster presentation. I understand the p value is important for significance but other than that what numbers are necessary and how would I report them? enter image description here edit** I do not completely understand what each of the values mean. I am trying to show how populations have changed over years.

I ran a glm looking at population changes over years, and am unsure which results I need to include for a poster presentation. I understand the p value is important for significance but other than that what numbers are necessary and how would I report them? enter image description here

I ran a glm looking at population changes over years, and am unsure which results I need to include for a poster presentation. I understand the p value is important for significance but other than that what numbers are necessary and how would I report them? enter image description here edit** I do not completely understand what each of the values mean. I am trying to show how populations have changed over years.

Post Closed as "Needs details or clarity" by kjetil b halvorsen
Source Link
Alex
  • 11
  • 1
  • 3
Loading