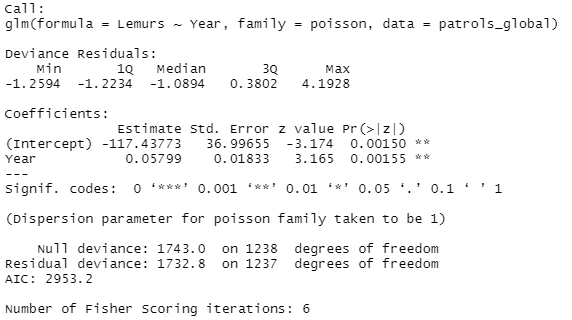
The information you include on a poster depends on what you want to demonstrate and the contextual knowledge of your audience. Since your goal is to show the change in the population of lemurs over the years, there are a few basic things I would suggest you include:
A time-series plot showing the lemur population each year.
Your point estimate for the regression coefficient years and an appropriate confidence interval around this point. (A confidence interval is typically more useful than giving a p-value for the hypothesis test for a non-zero coefficient; see Wasserstein and Lazar 2016.)
You should ensure that you are happy with your model and make some overall commentary on the fit of the model and whether you think it represents the data well. If you are presenting to a statistically-skilled audience, and you wish to go into more detail on your model and its fit properties, you could further augment this with some information about the overall goodness-of-fit of your model (e.g., McFadden's coefficient of determination) and possibly some plots of deviance residuals. This would usually be excessive for a poster presentation but it might be part of an underlying paper or supplementary material for the presentation.

