Bumped by Community user
edited title
Source Link
n0054
  • 31
  • 1
  • 3

How report post-hocplanned contrast test results

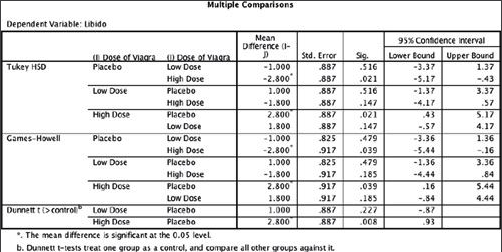
I was reading through Andy Field's Discovering Statistics with SPSS. Following ANOVA, he ran several post-hoc testsplanned contrasts.

enter image description here enter image description here

When he described how to report the planned contrast and post-hoc results, he wrote this:

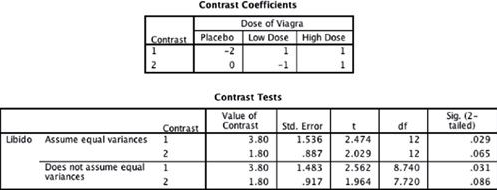
“Planned contrasts revealed that having any dose of Viagra significantly increased libido compared to having a placebo, t(12) = 2.47, p =.029, r =.58, but having a high dose did not significantly increase libido compared to having a low dose, t(12) = 2.03, p =.065, r =.51.”

Where did the r come from??

How report post-hoc test results

I was reading through Andy Field's Discovering Statistics with SPSS. Following ANOVA, he ran several post-hoc tests.

enter image description here enter image description here

When he described how to report the planned contrast and post-hoc results, he wrote this:

“Planned contrasts revealed that having any dose of Viagra significantly increased libido compared to having a placebo, t(12) = 2.47, p =.029, r =.58, but having a high dose did not significantly increase libido compared to having a low dose, t(12) = 2.03, p =.065, r =.51.”

Where did the r come from??
How report planned contrast test results

I was reading through Andy Field's Discovering Statistics with SPSS. Following ANOVA, he ran several planned contrasts.

enter image description here enter image description here

When he described how to report the planned contrast results, he wrote this:

“Planned contrasts revealed that having any dose of Viagra significantly increased libido compared to having a placebo, t(12) = 2.47, p =.029, r =.58, but having a high dose did not significantly increase libido compared to having a low dose, t(12) = 2.03, p =.065, r =.51.”

Where did the r come from??
Source Link
n0054
  • 31
  • 1
  • 3

How report post-hoc test results

I was reading through Andy Field's Discovering Statistics with SPSS. Following ANOVA, he ran several post-hoc tests.

enter image description here enter image description here

When he described how to report the planned contrast and post-hoc results, he wrote this:

“Planned contrasts revealed that having any dose of Viagra significantly increased libido compared to having a placebo, t(12) = 2.47, p =.029, r =.58, but having a high dose did not significantly increase libido compared to having a low dose, t(12) = 2.03, p =.065, r =.51.”

Where did the r come from??