It's hard to make a reasonable argumentargue that it doesn't matter if youra study with significant p-value is underpowered. If a study has low power and the null hypothesis is rejected, then the estimatesample statistic is likely to be a biased upward. The less power, the more inflated the effect size estimate of the population parameter. Yes, you are lucky to get evidence against the null hypothesis but also likely to be over-optimistic. The reviewer knows this so he asks how much power your study had to detect the effect you detected.
It's also unreasonablenot recommended to do post hoc-hoc power estimation. This is a much discussed topic on CV; see references below. In short – if your study was indeed underpowered – by doing post hoc-hoc power analysis you will compound the issue of an inflatedoverestimating the effect estimate by also overestimating the power. Mathematically, the power at the observed effect is a function of the p-value: if the p-value is small, the post-hoc power is large. It's as if the result is more convincing because the same fact — the null is rejected — gets reported twice.
Okay, so enough bad news. How can you respond to the reviewer? Computing the power retroactively is pointlessnot meaningful because your study is already done. Instead compute confidence interval(s) for the effect(s) of interest and emphasize estimation, not hypothesis testing. If the power of your study wasis low, the intervals will beare wide (as low power means that we can't make precise estimates). If the power of your study wasis high, the intervals will beare tight, demonstrating convincingly how much you have learned from your data.
If the reviewer insists on a power calculation, don't compute the power by plugging in the estimated effect for the true effect, aka post-hoc power. Instead do sensitivity power analysis: For example, fix the sample size, the power and the significance level, and determine the range of effect sizes that can be detected. Or fix the sample size and the significance, and plot power as a function of effect size. It will be especially informative to know what the power is for a range of realistic effect sizes.
Daniël Lakens discusses power at great length in Improving Your Statistical Inferences. There is even a section on "What to do if Your Editor Asks for Post-hoc Power?" He has great advice.
J. M. Hoenig and D. M. Heisey. The abuse of power. The American Statistician, 55(1):19–24, 2001.
A. Gelman. Don't calculate post-hoc power using observed estimate of effect size. Annals of Surgery, 269(1), 2019.
Do underpowered studies have increased likelihood of false positives?
What is the post-hoc power in my experiment? How to calculate this?
Why is the power of studies that only report significant effects not always 100%?
Post hoc power analysis for a non significant result?
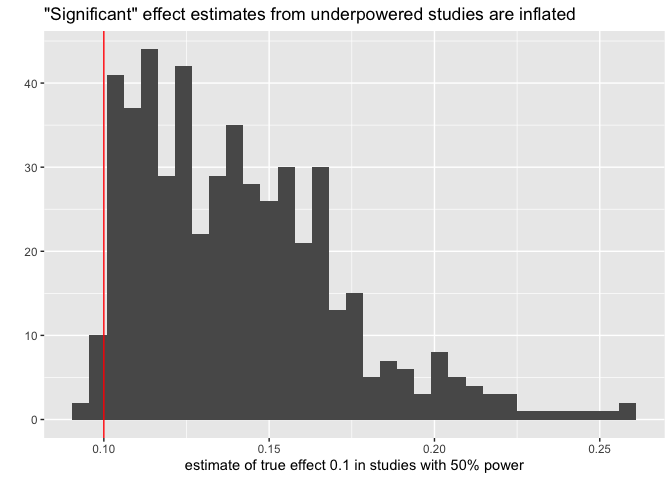
This simulation shows that "significant" estimates from underpowered studies are inflated. A study with little power to detect a small effect has more power to detect a large effect. So if the true effect is small and the null hypothesis of no effect is rejected, the estimated effect tends to be larger than the true one.
I simulate 1000 studies with 50%, so about half of the studies have p-value < 0.05. The sample means from those "significant" studies are mostly to the right of the true mean 0.1, ie. they overestimate the true mean, often by a lot.

library("pwr")
library("tidyverse")

# Choose settings for an underpowered study

mu0 <- 0
mu <- 0.1

sigma <- 1
alpha <- 0.05
power <- 0.5

pwr.t.test(d = (mu - mu0) / sigma, power = power, sig.level = alpha, type = "one.sample")
#>
#>      One-sample t test power calculation
#>
#>               n = 386.0261
#>               d = 0.1
#>       sig.level = 0.05
#>           power = 0.5
#>     alternative = two.sided

# Sample size to achieve 50% power to detect mean 0.1 with a one-sided t-test
n <- 387

# Simulate 1,000 studies with low power

set.seed(123)
reps <- 1000

studies <-
  tibble(
    study = rep(seq(reps), each = n),
    x = rnorm(reps * n, mean = mu, sd = sigma)
  )

results <- studies %>%
  group_by(
    study
  ) %>%
  group_modify(
    ~ broom::tidy(t.test(.))
  )

# Plot a histogram of the estimate effects for those studies where the null was rejected.

results %>%
  # We are only interested in studies where the null is rejected
  filter(
    p.value < alpha
  ) %>%
  ggplot(
    aes(estimate)
  ) +
  geom_histogram(
    bins = 33
  ) +
  geom_vline(
    xintercept = mu,
    color = "red"
  ) +
  labs(
    x = glue::glue("estimate of true effect {mu} in studies with {100*power}% power"),
    y = "",
    title = "\"Significant\" effect estimates from underpowered studies are inflated"
  )


