Bumped by Community user
added 889 characters in body
Source Link
import numpy as np
import pandas as pd
import scipy as sp
from scipy import stats

xdata = pd.read_csv('linear_variable'Data_example.csv')

x = data.Rate # dependent linear variable
theta = pddata.read_csvWindDir_deg * ('wind_direction3.csv'14159265359/180) # corresponding measured wind directions (inconverted to radians)

rxc = np.array(sp.stats.pearsonr(x,np.cos(theta)))
rxs = np.array(sp.stats.pearsonr(x,np.sin(theta)))
rcs = np.array(sp.stats.pearsonr(np.cos(theta),np.sin(theta)))

rho = np.sqrt(((rxc)**2 + (rxs)**2 - (rxc)*(rxs)*(rcs)) / (1 - (rcs)**2))

print("Correlation coefficient, ", rho)

Example Data

     Rate       WindDir_deg
0   -0.102186   180
1   -0.051093   200
2   -0.026898   40
3   -0.012773   180
4   -0.004927   0
5   -0.002488   50
6   0.000000    180
7   0.000000    160
8   0.000000    180
9   0.018639    170
10  0.019800    320
11  0.021236    160
12  0.025028    20
13  0.026400    240
14  0.030280    160
15  0.033402    150
16  0.037174    190
17  0.040175    180
18  0.041331    160
19  0.049942    190
20  0.051093    120
21  0.052635    140
22  0.052800    360
23  0.057955    170
24  0.057955    170
25  0.057955    30
26  0.059413    330
27  0.060490    170
28  0.060560    20
29  0.063866    190
30  0.070678    170
31  0.072444    240
32  0.085714    160
33  0.101950    0
34  0.105600    0
35  0.110216    40
36  0.120980    180
37  0.121660    170
38  0.145200    10
39  0.173865    180
40  0.204372    180
41  0.242240    30
42  0.351462    180
43  0.360800    170
44  0.423920    30
45  0.592800    160
46  0.741000    190
47  1.937873    170
import numpy as np
import pandas as pd
import scipy as sp
from scipy import stats

x = pd.read_csv('linear_variable.csv') # dependent variable
theta = pd.read_csv('wind_direction.csv') # corresponding measured wind directions (in radians)

rxc = np.array(sp.stats.pearsonr(x,np.cos(theta)))
rxs = np.array(sp.stats.pearsonr(x,np.sin(theta)))
rcs = np.array(sp.stats.pearsonr(np.cos(theta),np.sin(theta)))

rho = np.sqrt(((rxc)**2 + (rxs)**2 - (rxc)*(rxs)*(rcs)) / (1 - (rcs)**2))

print("Correlation coefficient, ", rho)
import numpy as np
import pandas as pd
import scipy as sp
from scipy import stats

data = pd.read_csv('Data_example.csv')

x = data.Rate # dependent linear variable
theta = data.WindDir_deg * (3.14159265359/180) # corresponding measured wind directions (converted to radians)

rxc = np.array(sp.stats.pearsonr(x,np.cos(theta)))
rxs = np.array(sp.stats.pearsonr(x,np.sin(theta)))
rcs = np.array(sp.stats.pearsonr(np.cos(theta),np.sin(theta)))

rho = np.sqrt(((rxc)**2 + (rxs)**2 - (rxc)*(rxs)*(rcs)) / (1 - (rcs)**2))

print("Correlation coefficient, ", rho)

Example Data

     Rate       WindDir_deg
0   -0.102186   180
1   -0.051093   200
2   -0.026898   40
3   -0.012773   180
4   -0.004927   0
5   -0.002488   50
6   0.000000    180
7   0.000000    160
8   0.000000    180
9   0.018639    170
10  0.019800    320
11  0.021236    160
12  0.025028    20
13  0.026400    240
14  0.030280    160
15  0.033402    150
16  0.037174    190
17  0.040175    180
18  0.041331    160
19  0.049942    190
20  0.051093    120
21  0.052635    140
22  0.052800    360
23  0.057955    170
24  0.057955    170
25  0.057955    30
26  0.059413    330
27  0.060490    170
28  0.060560    20
29  0.063866    190
30  0.070678    170
31  0.072444    240
32  0.085714    160
33  0.101950    0
34  0.105600    0
35  0.110216    40
36  0.120980    180
37  0.121660    170
38  0.145200    10
39  0.173865    180
40  0.204372    180
41  0.242240    30
42  0.351462    180
43  0.360800    170
44  0.423920    30
45  0.592800    160
46  0.741000    190
47  1.937873    170
Source Link

How to calculate the value (wind direction) of "maximal effect" in a linear-circular correlation?

I am trying to evaluate the effect of wind direction (circular variable) on a dependent linear variable. I have used circular-linear regression to find the correlation coefficient between the two variables, shown in the code sample below.

import numpy as np
import pandas as pd
import scipy as sp
from scipy import stats

x = pd.read_csv('linear_variable.csv') # dependent variable
theta = pd.read_csv('wind_direction.csv') # corresponding measured wind directions (in radians)

rxc = np.array(sp.stats.pearsonr(x,np.cos(theta)))
rxs = np.array(sp.stats.pearsonr(x,np.sin(theta)))
rcs = np.array(sp.stats.pearsonr(np.cos(theta),np.sin(theta)))

rho = np.sqrt(((rxc)**2 + (rxs)**2 - (rxc)*(rxs)*(rcs)) / (1 - (rcs)**2))

print("Correlation coefficient, ", rho)

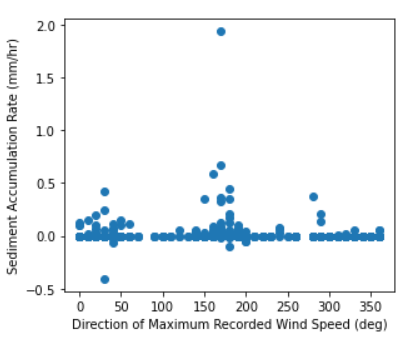
Now how do I estimate the actual wind direction that has the maximal effect on the linear variable? For example in the data shown in this plot, the wind direction with maximal effect on the linear variable appears to be somewhere between 150° and 200°, but how to I calculate this mathematically?

enter image description here