Context
I'm working with product data for a retail company. I have the daily impressions (number of times it was viewed online) for all products over a 30 day period (can get more data).
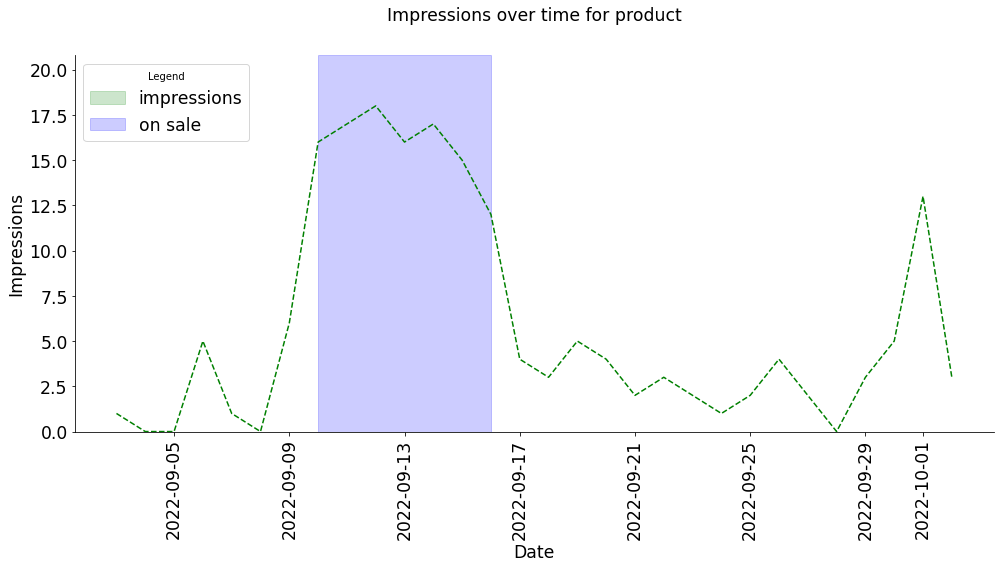
Here is the data for one product:
on_sale = [False, False, False, False, False, False, False, True, True, True, True, True, True, True, False, False, False, False, False, False, False, False, False, False, False, False, False, False, False, False]
impressions = [1,0,0,5,1,0,6,16,17,18,16,17,15,12,4,3,5,4,2,3,2,1,2,4,2,0,3,5,13,3]
So this product was on sale from index 7 to index 13.
We expect that when a product is on sale, it will see an increased number of impressions.
We have introduced a new piece of logic that identifies all on sale products and moves them up into a 'better' advertising campaign, with the aim of increasing their impressions over and above what the normal level of impressions for that on sale product would be.
Question
What is the best way to test the impact of this new piece of logic? In particular, how can I test the impact of moving on sale products into a better campaign (in terms of impressions) relative to what we'd expect for the same on sale products without moving them up a campaign?
I imagine some sort of A/B test where I randomly take some of the on sale products and apply the new logic to them (i.e. move the products up) and compare the change in impressions to a control group of on sale products that I don't apply the new logic to.
Any insight into this problem would be great. I am looking for test that can be implemented in python.

