edited body
Source Link
jpsmith
  • 329
  • 1
  • 12

I have count data by group for which I would like to to model the outcome using a random effect for group. I was initially planning on using Poisson regression, but checked if the data are overdispersed to determine if a negative binomial distribution should be used.

Overall, the outcome data were indeed overdispersed, so was planning to go with NB. However, when assessing clusters individually, some of the clusters had within-cluster data were not overdispersed (ie, Poisson distributed).

Should I use the overall distribution of the data to determine between Poisson or NB GEE models, or are there alternative approaches when distribution differences by cluster are present?

I am using lme4::glmer and lme4::glmer.nb in R to implement this, for example:

Here are some sample data:

set.seed(123)
df <- data.frame(group = rep(LETTERS[1:4], each = 100),
                 arm = rep(c("Intervention", "Control"), each = 100),
                 ncount = c(rpois(100, lambda = 5), rpois(100, lambda = 5),
                            rnbinom(100, mu = 5, size = 0.50), rnbinom(100, mu = 5, size = 0.50)))

Here outcomes in groups A and B are Poisson distributed, and C and ED are NB distributed.

par(mfrow = c(2,2))
sapply(unique(df$group), \(x) hist(df$ncount[df$group == x], main = paste0("Group ", x), xlab = "value"))
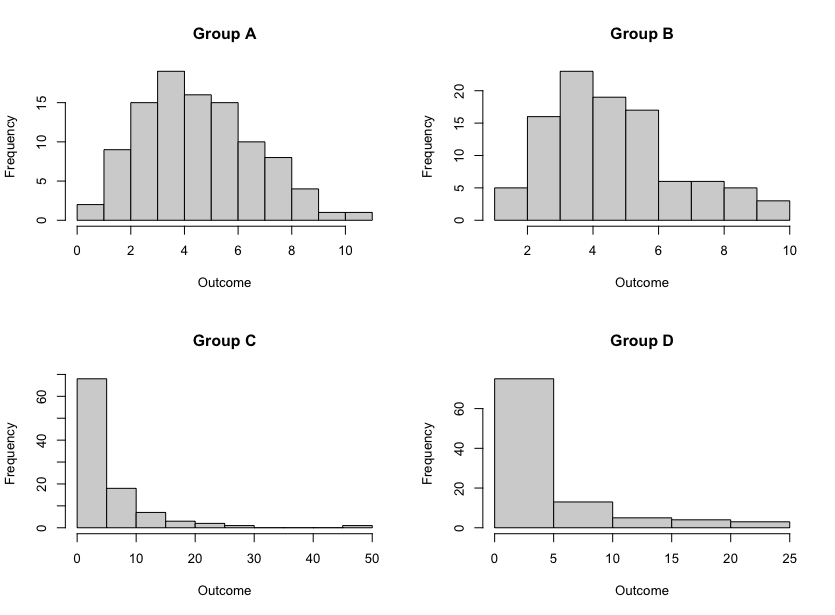
enter image description here And from the model information, it appears as if the NB approach is best:

poi <- lme4::glmer(ncount ~ arm + (1|group), data = df, family = "poisson")
nb <- lme4::glmer.nb(ncount ~ arm + (1|group), data = df)

data.frame(poi = summary(poi)$AICtab,
          nb = summary(nb)$AICtab)

#                poi        nb
# AIC       2787.536  2122.132
# BIC       2799.511  2138.098
# logLik   -1390.768 -1057.066
# deviance  2781.536  2114.132
# df.resid   397.000   396.000

In this example, which generally follows my real data, my plan would be to proceed with the negative binomial, but I am not sure if there are more accurate methods that account for this phenomenon.

I have count data by group for which I would like to to model the outcome using a random effect for group. I was initially planning on using Poisson regression, but checked if the data are overdispersed to determine if a negative binomial distribution should be used.

Overall, the outcome data were indeed overdispersed, so was planning to go with NB. However, when assessing clusters individually, some of the clusters had within-cluster data were not overdispersed (ie, Poisson distributed).

Should I use the overall distribution of the data to determine between Poisson or NB GEE models, or are there alternative approaches when distribution differences by cluster are present?

I am using lme4::glmer and lme4::glmer.nb in R to implement this, for example:

Here are some sample data:

set.seed(123)
df <- data.frame(group = rep(LETTERS[1:4], each = 100),
                 arm = rep(c("Intervention", "Control"), each = 100),
                 ncount = c(rpois(100, lambda = 5), rpois(100, lambda = 5),
                            rnbinom(100, mu = 5, size = 0.50), rnbinom(100, mu = 5, size = 0.50)))

Here outcomes in groups A and B are Poisson distributed, and C and E are NB distributed.

par(mfrow = c(2,2))
sapply(unique(df$group), \(x) hist(df$ncount[df$group == x], main = paste0("Group ", x), xlab = "value"))

enter image description here And from the model information, it appears as if the NB approach is best:

poi <- lme4::glmer(ncount ~ arm + (1|group), data = df, family = "poisson")
nb <- lme4::glmer.nb(ncount ~ arm + (1|group), data = df)

data.frame(poi = summary(poi)$AICtab,
          nb = summary(nb)$AICtab)

#                poi        nb
# AIC       2787.536  2122.132
# BIC       2799.511  2138.098
# logLik   -1390.768 -1057.066
# deviance  2781.536  2114.132
# df.resid   397.000   396.000

In this example, which generally follows my real data, my plan would be to proceed with the negative binomial, but I am not sure if there are more accurate methods that account for this phenomenon.

I have count data by group for which I would like to to model the outcome using a random effect for group. I was initially planning on using Poisson regression, but checked if the data are overdispersed to determine if a negative binomial distribution should be used.

Overall, the outcome data were indeed overdispersed, so was planning to go with NB. However, when assessing clusters individually, some of the clusters had within-cluster data were not overdispersed (ie, Poisson distributed).

Should I use the overall distribution of the data to determine between Poisson or NB GEE models, or are there alternative approaches when distribution differences by cluster are present?

I am using lme4::glmer and lme4::glmer.nb in R to implement this, for example:

Here are some sample data:

set.seed(123)
df <- data.frame(group = rep(LETTERS[1:4], each = 100),
                 arm = rep(c("Intervention", "Control"), each = 100),
                 ncount = c(rpois(100, lambda = 5), rpois(100, lambda = 5),
                            rnbinom(100, mu = 5, size = 0.50), rnbinom(100, mu = 5, size = 0.50)))

Here outcomes in groups A and B are Poisson distributed, and C and D are NB distributed.

par(mfrow = c(2,2))
sapply(unique(df$group), \(x) hist(df$ncount[df$group == x], main = paste0("Group ", x), xlab = "value"))

enter image description here And from the model information, it appears as if the NB approach is best:

poi <- lme4::glmer(ncount ~ arm + (1|group), data = df, family = "poisson")
nb <- lme4::glmer.nb(ncount ~ arm + (1|group), data = df)

data.frame(poi = summary(poi)$AICtab,
          nb = summary(nb)$AICtab)

#                poi        nb
# AIC       2787.536  2122.132
# BIC       2799.511  2138.098
# logLik   -1390.768 -1057.066
# deviance  2781.536  2114.132
# df.resid   397.000   396.000

In this example, which generally follows my real data, my plan would be to proceed with the negative binomial, but I am not sure if there are more accurate methods that account for this phenomenon.

edited tags
Link
jpsmith
  • 329
  • 1
  • 12
added 1434 characters in body; edited tags; edited title
Source Link
jpsmith
  • 329
  • 1
  • 12

Poisson or Negative Binomial GEE regression when within-cluster data follow different distributions

I have count data by clinic (cluster)group for which I would like to use generalized estimating equations to model the outcome using a random effect for group. I was initially planning on using Poisson GEEregression, but checked if the data are overdispersed to determine if a negative binomial distribution should be used.

Overall, the outcome data were indeed overdispersed, so was planning to go with NB. However, when assessing clusters individually, some of the clusters had within-cluster data were not overdispersed (ie, Poisson distributed).

Should I use the overall distribution of the data to determine between Poisson or NB GEE models, or are there alternative approaches when distribution differences by cluster are present?

I am using lme4::glmer and lme4::glmer.nb in R to implement this, for example:

Here are some sample data:

set.seed(123)
df <- data.frame(group = rep(LETTERS[1:4], each = 100),
                 arm = rep(c("Intervention", "Control"), each = 100),
                 ncount = c(rpois(100, lambda = 5), rpois(100, lambda = 5),
                            rnbinom(100, mu = 5, size = 0.50), rnbinom(100, mu = 5, size = 0.50)))

Here outcomes in groups A and B are Poisson distributed, and C and E are NB distributed.

par(mfrow = c(2,2))
sapply(unique(df$group), \(x) hist(df$ncount[df$group == x], main = paste0("Group ", x), xlab = "value"))

enter image description here And from the model information, it appears as if the NB approach is best:

poi <- lme4::glmer(ncount ~ arm + (1|group), data = df, family = "poisson")
nb <- lme4::glmer.nb(ncount ~ arm + (1|group), data = df)

data.frame(poi = summary(poi)$AICtab,
          nb = summary(nb)$AICtab)

#                poi        nb
# AIC       2787.536  2122.132
# BIC       2799.511  2138.098
# logLik   -1390.768 -1057.066
# deviance  2781.536  2114.132
# df.resid   397.000   396.000

In this example, which generally follows my real data, my plan would be to proceed with the negative binomial, but I am not sure if there are more accurate methods that account for this phenomenon.

Poisson or Negative Binomial GEE regression when within-cluster data follow different distributions

I have count data by clinic (cluster) for which I would like to use generalized estimating equations to model the outcome. I was initially planning on using Poisson GEE, but checked if the data are overdispersed to determine if a negative binomial distribution should be used.

Overall, the outcome data were indeed overdispersed, so was planning to go with NB. However, when assessing clusters individually, some of the clusters had within-cluster data were not overdispersed (ie, Poisson distributed).

Should I use the overall distribution of the data to determine between Poisson or NB GEE models, or are there alternative approaches when distribution differences by cluster are present?

Poisson or Negative Binomial regression when within-cluster data follow different distributions

I have count data by group for which I would like to to model the outcome using a random effect for group. I was initially planning on using Poisson regression, but checked if the data are overdispersed to determine if a negative binomial distribution should be used.

Overall, the outcome data were indeed overdispersed, so was planning to go with NB. However, when assessing clusters individually, some of the clusters had within-cluster data were not overdispersed (ie, Poisson distributed).

Should I use the overall distribution of the data to determine between Poisson or NB GEE models, or are there alternative approaches when distribution differences by cluster are present?

I am using lme4::glmer and lme4::glmer.nb in R to implement this, for example:

Here are some sample data:

set.seed(123)
df <- data.frame(group = rep(LETTERS[1:4], each = 100),
                 arm = rep(c("Intervention", "Control"), each = 100),
                 ncount = c(rpois(100, lambda = 5), rpois(100, lambda = 5),
                            rnbinom(100, mu = 5, size = 0.50), rnbinom(100, mu = 5, size = 0.50)))

Here outcomes in groups A and B are Poisson distributed, and C and E are NB distributed.

par(mfrow = c(2,2))
sapply(unique(df$group), \(x) hist(df$ncount[df$group == x], main = paste0("Group ", x), xlab = "value"))

enter image description here And from the model information, it appears as if the NB approach is best:

poi <- lme4::glmer(ncount ~ arm + (1|group), data = df, family = "poisson")
nb <- lme4::glmer.nb(ncount ~ arm + (1|group), data = df)

data.frame(poi = summary(poi)$AICtab,
          nb = summary(nb)$AICtab)

#                poi        nb
# AIC       2787.536  2122.132
# BIC       2799.511  2138.098
# logLik   -1390.768 -1057.066
# deviance  2781.536  2114.132
# df.resid   397.000   396.000

In this example, which generally follows my real data, my plan would be to proceed with the negative binomial, but I am not sure if there are more accurate methods that account for this phenomenon.

edited tags
Link
jpsmith
  • 329
  • 1
  • 12
Loading
edited tags
Link
jpsmith
  • 329
  • 1
  • 12
Loading
Source Link
jpsmith
  • 329
  • 1
  • 12
Loading