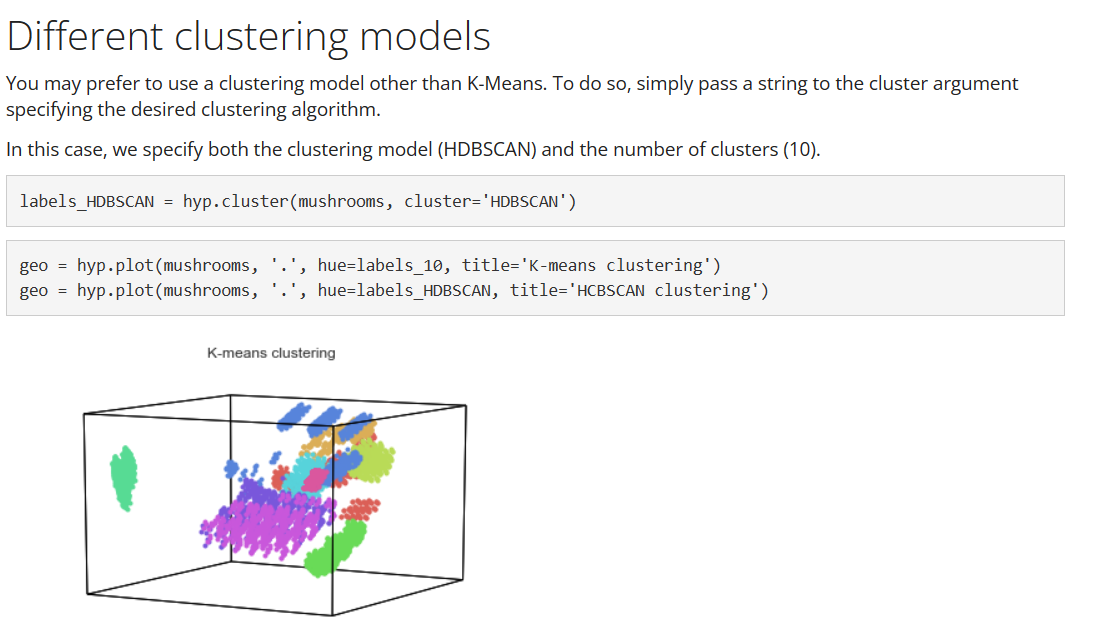
I was reading the hypertoolshypertools docs and came across this pictorial that shows 10 clusters (some seem to share very similar coloring) generated from some (mushroom) data. I was wondering what in the K-Means algorithm would cause these clusters to sort of overlap? e.g. For instance, you can see some red patches surrounded/separated by green and also blue patches in between pink:
 Link to the hypertools docs.
