added 7 characters in body
Source Link
User1865345
  • 10.3k
  • 12
  • 23
  • 40

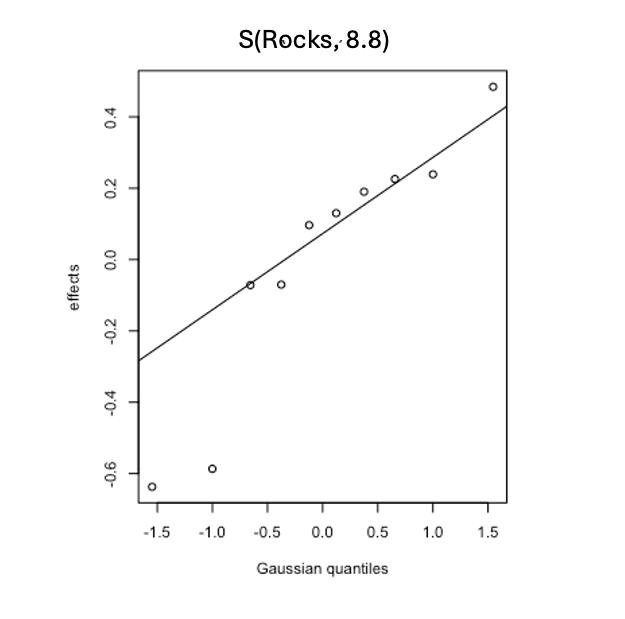
Model runs are fine. Interpreting effects is easier for factors. What is not straight forward are the outputs/plots for variables with factor levels assigned a random effect. The plots I am trying to interpret includes factor levels as dots, effects on the y-axis, and gaussian quantiles on the x-axis. There is a straight line going through the dots that looks linear-positive.

How to interpret these plots for factor variables? What does the line through the dots mean? And what does 8.8 in the top of plot mean? Would greatly appreciate any help with interpretation.plot.gam() output for a random effect (or factor) variable
ModRun <- gam(Flies~ s(log(LENGTH+1))+
                              s(GRADIENT)+#
                              s(ROCKS,bs="re")+
                              s(MILES),
                                       
                              data=dat,
                              family=nb(link = "log"),
                              method="ML",optimizer="efs")

Model runs are fine. Interpreting effects is easier for factors. What is not straight forward are the outputs/plots for variables with factor levels assigned a random effect. The plots I am trying to interpret includes factor levels as dots, effects on the y-axis, and gaussian quantiles on the x-axis. There is a straight line going through the dots that looks linear-positive.

How to interpret these plots for factor variables? What does the line through the dots mean? And what does 8.8 in the top of plot mean? Would greatly appreciate any help with interpretation.plot.gam() output for a random effect (or factor) variable

ModRun <- gam(Flies~ s(log(LENGTH+1))+
                              s(GRADIENT)+#
                              s(ROCKS,bs="re")+
                              s(MILES),
                                       
                              data=dat,
                              family=nb(link = "log"),
                              method="ML",optimizer="efs")
added 381 characters in body
Source Link

Model runs are fine. Interpreting effects is easier for factors. What is not straight forward are the outputs/plots for variables with factor levels assigned a random effect. The plots I am trying to interpret includes factor levels as dots, effects on the y-axis, and gaussian quantiles on the x-axis. There is a straight line going through the dots that looks linear-positive.

How to interpret these plots for factor variables? What does the line through the dots mean? And what does 8.8 in the top of plot mean? Would greatly appreciate any help with interpretation.plot.gam() output for a random effect (or factor) variable

ModRun <- gam(Flies~ s(log(LENGTH+1))+
                              s(GRADIENT)+#
                              s(ROCKS,bs="re")+
                              s(MILES),
                                       
                              data=dat,
                              family=nb(link = "log"),
                              method="ML",optimizer="efs")

Model runs are fine. Interpreting effects is easier for factors. What is not straight forward are the outputs/plots for variables with factor levels assigned a random effect. The plots I am trying to interpret includes factor levels as dots, effects on the y-axis, and gaussian quantiles on the x-axis. There is a straight line going through the dots that looks linear-positive.

How to interpret these plots for factor variables? What does the line through the dots mean? And what does 8.8 in the top of plot mean? Would greatly appreciate any help with interpretation.plot.gam() output for a random effect (or factor) variable

ModRun <- gam(Flies~ s(log(LENGTH+1))+
                              s(GRADIENT)+#
                              s(ROCKS,bs="re")+
                              s(MILES),
                                       
                              data=dat,
                              family=nb(link = "log"),
                              method="ML",optimizer="efs")
Source Link

Interpreting random effect in GAM output: gaussian quantiles

Model runs are fine. Interpreting effects is easier for factors. What is not straight forward are the outputs/plots for variables with factor levels assigned a random effect. The plots I am trying to interpret includes factor levels as dots, effects on the y-axis, and gaussian quantiles on the x-axis. There is a straight line going through the dots that looks linear-positive.

How to interpret these plots for factor variables? What does the line through the dots mean? And what does 8.8 in the top of plot mean? Would greatly appreciate any help with interpretation.plot.gam() output for a random effect (or factor) variable