0
$\begingroup$

I have data from an experiment I ran in which I paired individuals up to play a game with another person. Before and after the game, some baseline and endline measures are collected, and the DV of interest is usually some change score on these measures. The "treatment" is whether a given participant played with someone of the opposite sex. Crucially, I cluster standard errors at the "team" level to control for within-team correlations.

We find that the game is effective at changing the DVs of interest. However, we really want to know what about the game is driving the change. There are a huge number of potential demographic moderators (age, income, education, political affiliation, etc) that might generate heterogeneous treatment effects, and there are also a lot of "in-game" variables that might matter (e.g. the total amount of chatting participants did with one another).

I'm looking for an approach that allows me to pursue exploratory moderator analysis in this way with interpretable results.

I came across the grf package which can construct causal random forests, but the package seems extremely limited in its ability to generate interpretable output. I'm also skeptical of how accurate its estimates are in light of some recent papers showing that such models underperform relative to Bayesian approaches (see here).

I came across the causalml Python package, which has implementations of various "meta-learners" and uplift algorithms, which seem promising, but I don't know enough about this literature to know whether it resolves my problem.

Ideally, I'd like to be able to say what moderators are most important at producing "lift" in the treatment effect, along with some precise quantification of what that lift entails. Furthermore, my specific use-case has some clustering that I normally account for via cluster-robust standard errors, so if possible, the solution should account for this.

Any advice?

$\endgroup$
2
  • $\begingroup$ Is each player observed only once? $\endgroup$
    – dimitriy
    Commented Sep 30, 2021 at 18:44
  • $\begingroup$ Yes, each player is observed only once. $\endgroup$ Commented Oct 1, 2021 at 16:02

3 Answers 3

3
+100
$\begingroup$

Plotting

Purely as an initial explanatory investigation I would use some plots of effect-size vs moderator.

Using clustering or other reduction of dimensionality

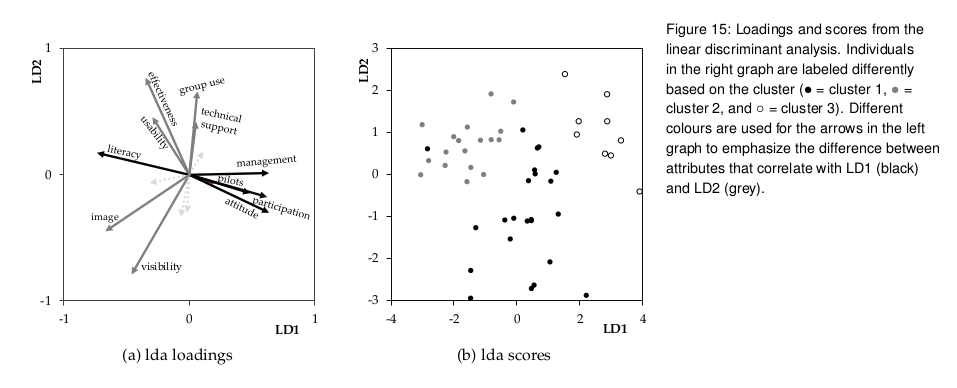
Potentially you might perform some cluster analysis on your population based on the other variables. Then after classifying your users into groups, or by expressing the group membership with some lda or pca score. With the reduction of the number of dimensions, you can see if there is a correlation between the group membership class or group membership score and the effect size.

Example

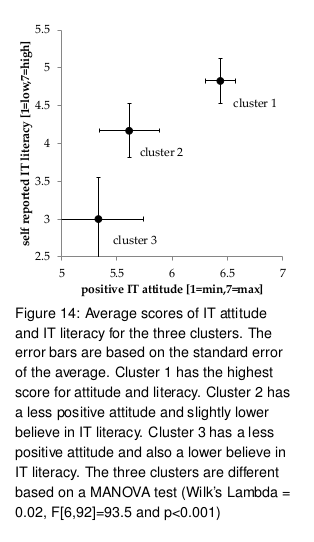
Below is an example of a little research performed while writing some software tools. The goal was to make a description of the user group, to find out how they differ regarding IT literacy and IT attitude and to see which attributes they find most important.

These two parameters where determined in a survey along with a bunch of other questions about the importance of different attributes.

The initial idea was actually to determine the importance of different attributes as a function of the IT literacy and IT attitude. E.g. people with more/less IT literacy/attitude are gonna find different attributes more/less important.

But it was turned around and the outcome of the dependent variables was seen to be clustered.

clustering

Then based on these different clusters we can see how the "independent"/explanatory variable* is different for these clusters.

relation of clusters with independent variable

In your case:

  • Try and cluster variables. Or reduce dimensionality.

  • Instead of looking how the DV/effect differs as function of your potential moderators, you can try and see how the moderators differ as function of the DV/effect.

    The heterogeneity might occur because only a few people, with some property, will have some high effect size.

    • In this case, you could see this clearly by observing that people with a high effect size often have some properties of moderators.
    • But the other way around might not be so clear. When you look at the properties and see if the effect size differs, then it might be not significant if only a few have a high effect size or if the effect size has a large spread.

*I write independent in quotes, because the variable is not really independent or controlled. It is a random variable. But I consider it as the explanatory variables. The attitudes are considered to be caused by the explanatory ("independent") variables.

$\endgroup$
3
$\begingroup$

There are clearly lots of ways you could attack this, and @Sextus Empiricus lists some good ones. From a slightly more practical point of view, I would think about doing the following.

  • Since each player plays only once, it's safe enough to just calculate change scores for each player.
  • Clustering by team is clearly a sensible thing to do, but it makes it difficult to apply a lot of off-the-shelf models, so I would probably ignore this clustering, and note this as a limitation of the analysis.
  • Obviously, this is a totally exploratory analysis, so I would probably forget about p-values. If you must report them, you'll need to correct for lots of comparisons, probably by controlling the false discovery rate.
  • Estimating the correlation of each moderator with the change scores, and ranking them, is a reasonable place to start.
  • After that, you could plug them all into a huge multiple regression model, and hope it runs.
  • You're overfitting the data at this point, so a next step would be to try penalised regression. In particular, you could use LASSO to identify a subset of moderators that are useful for predicting the change scores. LASSO can be difficult to interpret when your predictors are correlated though.
  • As noted in the other response, clustering the predictors may be useful. I would use factor analysis, rather than PCA, since this produces clusters that are more easily interpretable.
  • Partial least squares would be particularly useful here. Rather than clustering the moderators, and then testing which groups of moderators predict the change scores, which was the previous step, this involves directly identifying the most useful cluster for making predictions.
$\endgroup$
2
$\begingroup$

Given you've already come across the Bayesian approaches (Bayesian Additive Regression Trees, or BART), why don't you use those? In R the relevant packages would be 'dbarts' or 'BART'. 'dbarts' has a companion package 'bartCause' which adds wrappers for getting relevant causal estimands out of the model after estimation, although I'm not sure how good it as with the CATEs. My colleagues and I are also working on a package for this, which will interface with the 'BART' package, and provide a lot of the functionality you're looking for - it's still in development, but you can find it at https://github.com/bonStats/tidytreatment if you're interested.

$\endgroup$
2
  • $\begingroup$ Thanks for this. Just want through bartCause, and it doesn't seem like it has methods for interpreting the relative effect of the "confounders" on the lift of the treatment (something akin to variable importance, but with clearer interpretation). Are there straightforward ways to get at the effect of the moderators on the treatment effect with BARTs? What approaches do you recommend? $\endgroup$ Commented Feb 5, 2020 at 14:30
  • $\begingroup$ You can look at something like the interaction frequency (number of times a particular moderator appears in a tree with the treatment) - the tidytreatment package that will show that. The interaction frequency is only a rough guide to how important a moderator is, as it doesn't say anything about the magnitude of the splits. If it's a particular moderator it's a matter of manipulating both treatment and moderator simultaneously to get estimates of the treatment effect conditional on the moderator. You can see this paper academic.oup.com/poq/article/76/3/491/1893905 for examples. $\endgroup$
    – MartinQLD
    Commented Feb 6, 2020 at 22:56

Your Answer

By clicking “Post Your Answer”, you agree to our terms of service and acknowledge you have read our privacy policy.

Not the answer you're looking for? Browse other questions tagged or ask your own question.