1
$\begingroup$

I have a classification project on an imbalanced dataset (HomeCredit Kaggle dataset) and I have chosen Ridge Classifier (sklearn's implementation) as the most efficient both in terms of time and in terms of my performance indicator (ROC AUC score).

The initial dataset is widely imbalanced (0.92 TARGET = 0, 0.08 TARGET = 1) so I had to perform SMOTE oversampling to the train dataset to bring back the ratio to 50/50. There are about 450 features with 300k samples.

On a previous posts, commenters seemed dubious on the merits of oversampling. I have tried different ratios (from the intial ratio to 1 or 50/50) and there has been a linear improvement of ROC AUC when increasing the ratio and bringing it up to 1. So I think this is necessary in this case, possibly because of the high number of features.

Since I am requested to provide probabilities for my predictions, I have extended the RidgeClassifier class with softmax as such (from research on another post) :

class RidgeClassifierWithProba(RidgeClassifier):
    def predict_proba(self, X):
        d = self.decision_function(X)
        d_2d = np.c_[-d, d]
        return softmax(d_2d)

The final scores I get from my model are relatively good with a final ROC AUC score of 0.76 when taking into account those probabilities (0.70 with just the predictions). Top Kagglers have only been able to reach 0.805 during the competition so I think it is close enough.

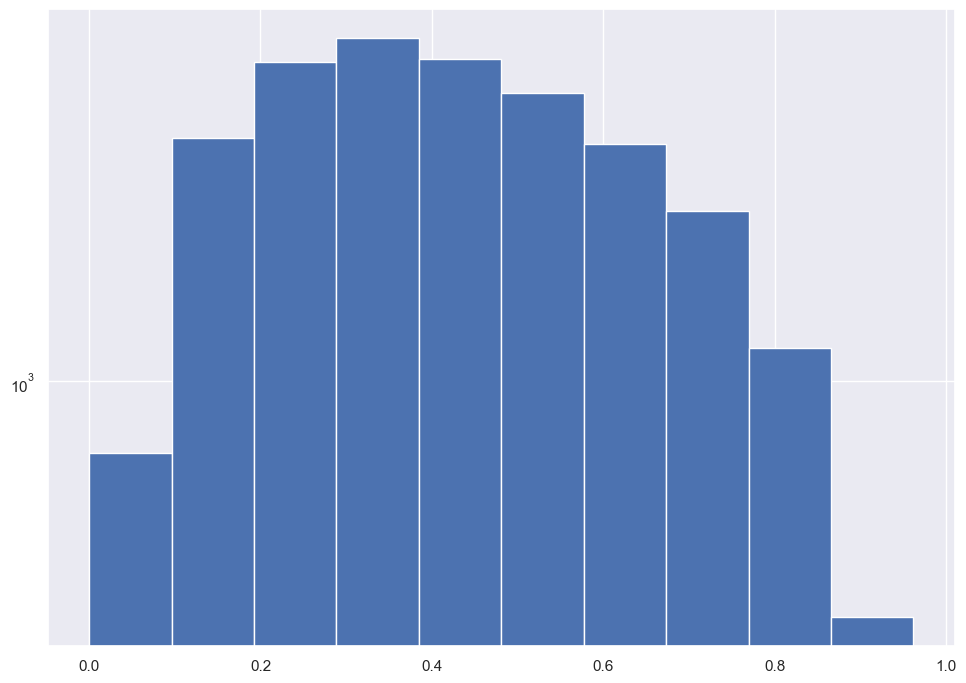
The problem is that the histogram of probabilities show that there is no separation between the 2 classes, with an almost normally distributed density :

enter image description here

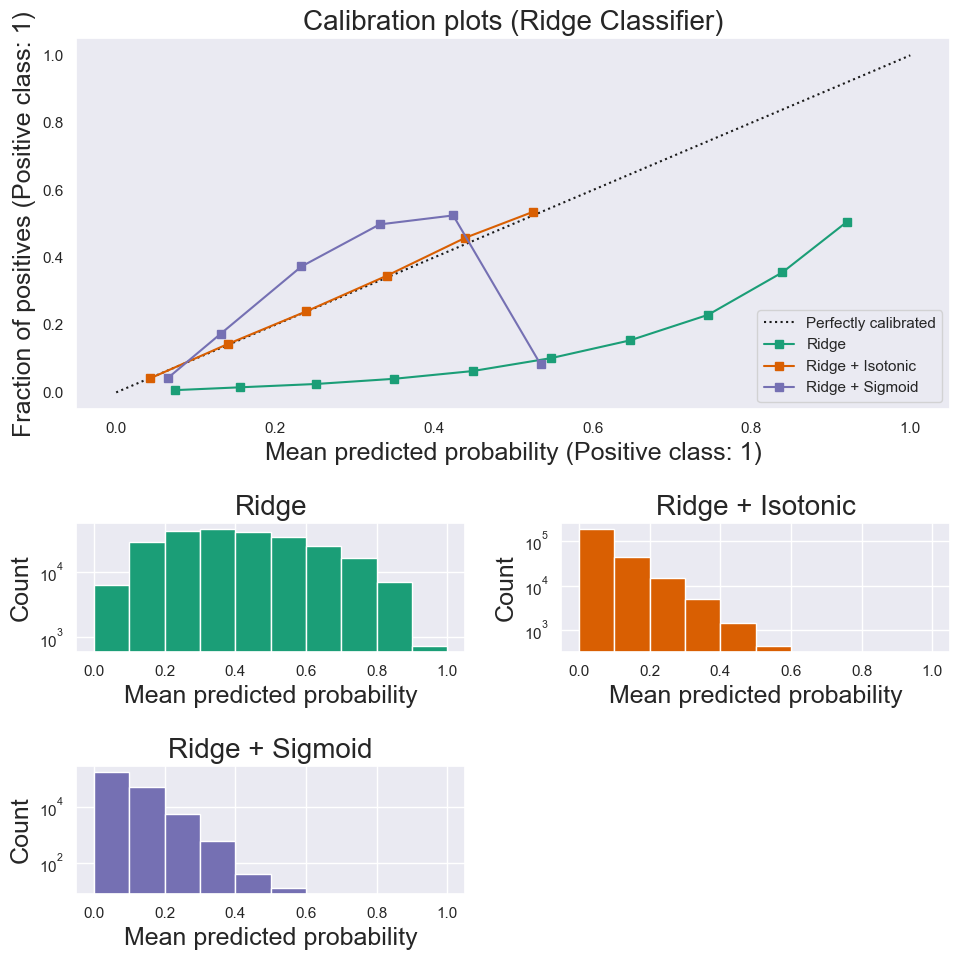
I tried to implement the following CalibratedClassifierCV functions to improve this distribution :

pipe_iso = CalibratedClassifierCV(final_pipe, cv=2, method="isotonic")
pipe_sig = CalibratedClassifierCV(final_pipe, cv=2, method="sigmoid")

But it make the probability distribution even worse, with all of them skewed towards the majority class :

enter image description here

Am I doing something wrong here? Is my model not good enough to have a separated probabilities histogram? What else can I do to calibrate my probabilities?

Edit : As requested by @Ben Reiniger, I uploaded my work on Kaggle : Link to Kagggle and am posting more code below. This is my final pipeline :

#Defining our final pipeline
final_pipe = Pipeline([
    ('cat_encode', cat_encode),
    ('imputation', SimpleImputer(strategy='median')),
    ('scaler', StandardScaler()),
    ('var', boruta),
    ('os', ADASYN()),
    ('ridge',RidgeClassifierWithProba(alpha=6.967)),
    ], memory="./Cache/")

If it makes any difference, this is an Imbalearn pipeline and not a Sklearn pipeline since it implements oversampling.

Cat encoder is a Column Transformer that imputes categorical fields based on the number of unique categories (One Hot when nunique <= 5 and WOE when nunique >5). Boruta is a FunctionTransformer built from a Boruta Selector.

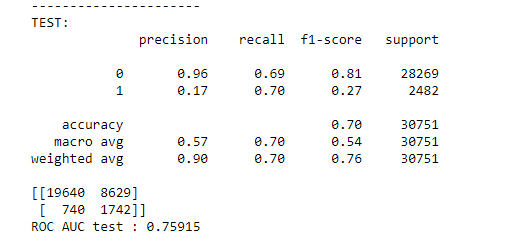
Here are my results on the test set (results on the train set are similar) :

enter image description here

To clarify my statement about the ROC AUC Score, when I feed only the predicted results from the base Ridge Classifier into the roc_auc_score function it returns 0.7 while when I feed it the probabilities it returns 0.76 (because it smoothes the curve).

final_pipe.fit(X_train_reduced, y_train)
train_predictions = final_pipe.predict(X_train_reduced)
proba_train = final_pipe.predict_proba(X_train_reduced)[:, 1]
test_predictions = final_pipe.predict(X_test)
proba_test = final_pipe.predict_proba(X_test)[:, 1]

roc_auc_score(y_test, test_predictions) #Returns 0.7
roc_auc_score(y_test, proba_test) #Returns 0.76

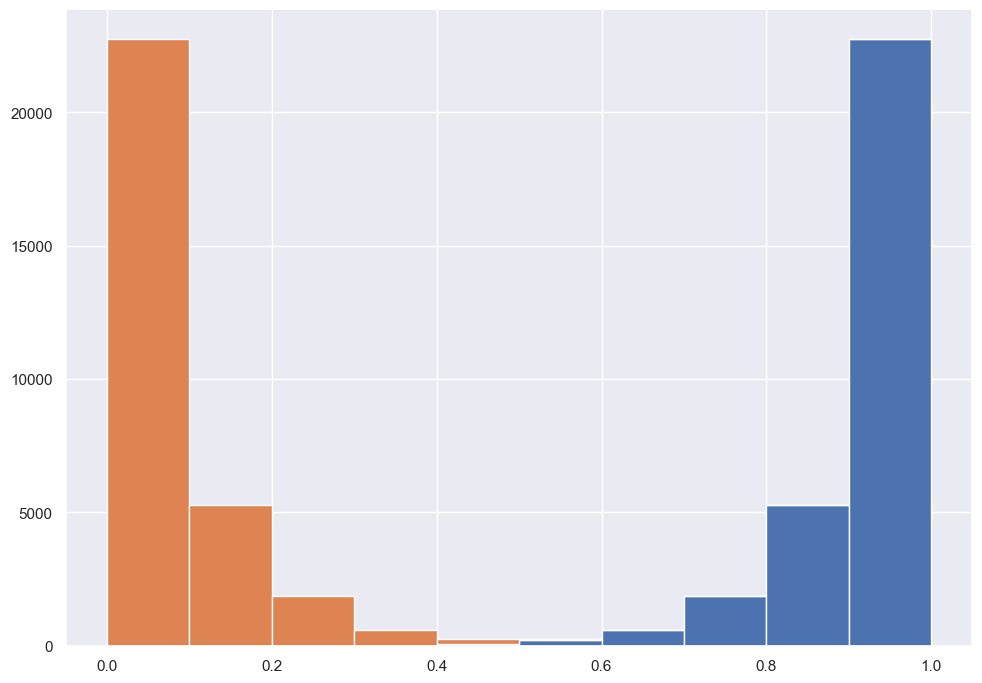
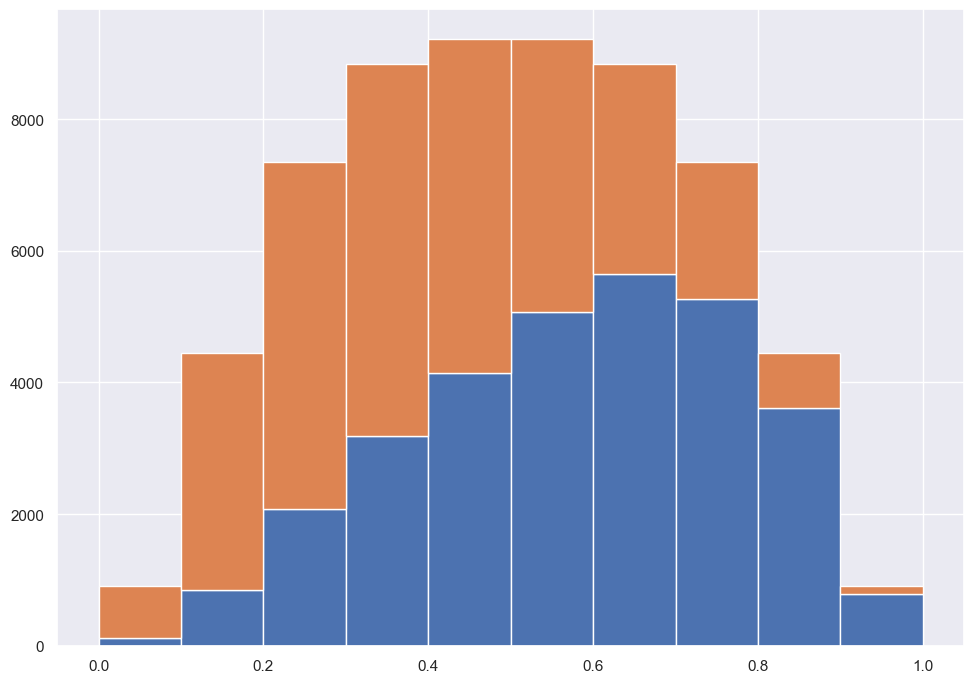
When calibrating the probablities with my isotonic calibrater, I get the following "stacked" bar chart, which looks good but actually the colors are the probabilities for each class. So unless I'm misunderstanding something it means that with a probability threshold of 0.5 this would predict that all test results are in the Majority (blue) class.

test_prob = pipe_iso.predict_proba(X_test)

plt.hist(test_prob, stacked=True)
plt.show()

enter image description here

For comparison this is the same chart with my uncalibrated pipeline :

enter image description here

$\endgroup$
9
  • $\begingroup$ just use a logistic regression instead of piling on one hack on top of another (as I assume previous posts have suggested). and see developers.google.com/machine-learning/crash-course/… $\endgroup$
    – seanv507
    Commented Sep 29, 2022 at 9:17
  • $\begingroup$ Logistic Regression returns a similar probability distribution, along with a less performant ROC and a fifty-fold increase in calculation time. What are the hacks you mention? The only thing I would qualify as a hack here is extending the Ridge Classifier with probabilities but it’s in line with what Logistic Regression returns. $\endgroup$
    – Octave
    Commented Sep 29, 2022 at 10:23
  • $\begingroup$ using ridge classifier instead of a model that will output a probability using smote adding a softmax trying to add another calibration layer on top of softmax [ you can probably adjust the computation time of the logistic regression] $\endgroup$
    – seanv507
    Commented Sep 29, 2022 at 11:59
  • $\begingroup$ Can you share some of your work (kaggle notebook?)? Does "(0.70 with just the predictions)" mean the hard class predictions? (You could use decision_function rather than softmax'ing, for the purposes of ROC.) Perhaps the histogram of scores would be more informative if you used stacked bars for the two classes. $\endgroup$ Commented Sep 29, 2022 at 14:08
  • $\begingroup$ @BenReiniger Thanks for your answer! I have clarified my statement in the main post, and also posted some code as well as a Kaggle link :) $\endgroup$
    – Octave
    Commented Sep 29, 2022 at 15:19

1 Answer 1

0
$\begingroup$

The problem is that the histogram of probabilities show that there is no separation between the 2 classes, with an almost normally distributed density

With an AUROC of 0.76, I think this is expected. If the distribution density was bimodal (and performance not trash, so that most of the data with values in the two peaks are correctly sorted), you'd get a large number of pairs put in the correct order (AUROC having one interpretation as "ratio of positive-negative pairs that appear in the correct order by score). And just because the scores are unimodel doesn't mean that the classes aren't somewhat well separated, hence my suggestion in a comment to split the bars by class.

But it make the probability distribution even worse, with all of them skewed towards the majority class

That's not worse! The majority class does dominate, and so the probabilities should be skewed towards it.

Note that the last bin in the sigmoid plot has very little data in it, so take the very low positive rate with a grain of salt. (You could also use strategy='quantile' instead of the default 'uniform' to make the bins in the plot equal-volume rather than equal-width.)

$\endgroup$
11
  • $\begingroup$ Thanks a lot for your thoughtful answrer. I have made significant edits in my main post and added a Kaggle link as requested. What I meant with the calibrated probabilities histogram is that there is no sample with a probability of belonging to the minority class > 0.5. So unless I'm completely misunderstanding what it represents I think it would mean that the calibrated model predicts that all samples belong to the minory class. I have provided the probability histograms as an edit also. It's not impossible that I'm completely misrepresenting the histograms though, I'm still learning! $\endgroup$
    – Octave
    Commented Sep 29, 2022 at 15:38
  • 1
    $\begingroup$ The point is that calibration is giving you better probability estimates, and that those are naturally skewed low. You shouldn't pay much attention to any results relying on a 50% cutoff; your lender probably won't want to lend money to someone with a 49% probability of default! $\endgroup$ Commented Sep 29, 2022 at 16:37
  • $\begingroup$ I understand but then I have a hard time figuring out how the pipeline actually predicts the minority class when all samples have a > 50% probability of belonging to the majority class. $\endgroup$
    – Octave
    Commented Sep 29, 2022 at 17:56
  • 1
    $\begingroup$ @Octave You need to decide how to consume the predicted probabilities. For example, you might compute the expected profit of the loan and approve positive-expected-value (or maybe some minimum positive threshold profitability) applications, which may translate to a probability threshold of say 5%. $\endgroup$ Commented Sep 29, 2022 at 18:04
  • $\begingroup$ In that case, the Ridge Classifying algorithm automatically determines the threshold? Is it possible to know what threshold it selects? $\endgroup$
    – Octave
    Commented Sep 29, 2022 at 19:31

Your Answer

By clicking “Post Your Answer”, you agree to our terms of service and acknowledge you have read our privacy policy.

Not the answer you're looking for? Browse other questions tagged or ask your own question.