1
$\begingroup$

I was wondering if there is a package I can use to convert my 22 annual observations to quarterly series?

Will there be any harm in doing so? Will I lose any important data specific information? I want to run VARs in levels using TY method.

$\endgroup$
1
  • 2
    $\begingroup$ Clarification request: Are you wanting to take 22 observations at one observation per year and turn them into one observation per quarter using frequency-domain methods OR are you wanting to take 22 observations per year and summarize them into 4 observations per year? (Non-statistician here) By VAR do you mean vector autoregression OR variances? What is TY method? $\endgroup$ Commented Apr 5, 2013 at 19:50

3 Answers 3

0
$\begingroup$

Yes, Eviews does that. There are various methods, such as quadratic match method, constant-match average, etc. I am not sure whether it is available in other packages.

Details here.

$\endgroup$
2
  • $\begingroup$ Hi many thanks for your answers, I have 22 annual data. I want to convert each observation into four quarterly series so that I will have longer series, 88 quarterly observations. VAR is Vector Autoregression, TY-toda yamamoto. I used Eviews cubic splines method, I thought maybe I will use R package if any has been developed? $\endgroup$
    – mr.rox
    Commented Apr 6, 2013 at 11:59
  • $\begingroup$ @ Rosh Rosh: Please check the answer as correct so that it will he helpful for other users. $\endgroup$
    – Metrics
    Commented Apr 6, 2013 at 12:19
6
$\begingroup$

I don't think this is conceptually possible. I don't know how Eviews can claim to do this (@user1493368's answer). It sounds incredibly dangerous.

Apart from anything else, if you have 22 observations, that is all you have - you cannot somehow pretend you have 88 and then use them in a model as though you had four times as many data points as you do.

Putting aside that, consider the two series below, which are drawn from real life data. Once you have aggregated up from the quarterly to the annual series, there is simply no way you can go back to the quarterly data, unless you fabricate a) the seasonality and b) the inter-quarter randomness. Of course, you could make some "assumptions" about those two things, but you shouldn't fool yourself that you're doing anything other than arbitrarily making up data.
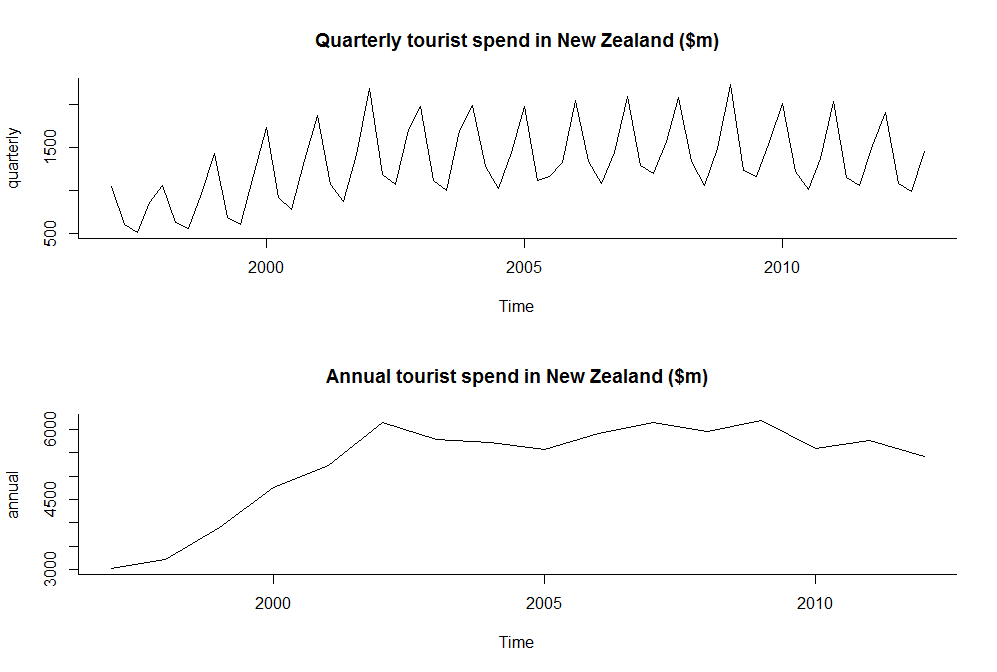
enter image description here

$\endgroup$
7
  • $\begingroup$ Many thanks Peter Ellis, I have used this method before, I will just disaggregate the annual data into four quarterly values, the last value will be the same figure as in the annual figure for the year. When you plot the resulting quarterly series, it will overlap the annual figures preserving the original information. I know eviews has option to use cubic splines to do this job, but I am not sure how safe it is to apply it in an empirical research article. $\endgroup$
    – mr.rox
    Commented Apr 6, 2013 at 23:30
  • $\begingroup$ Well, you can do what in effect the second plot does by interpolating lines between each point and call that "quarterly" data but it still isn't really quarterly data - it has no resemblance to the top plot. So if you put it into a model that expects real quarterly data you will get a misleading result. I think you would be better off taking your other variables' quarterly data and aggregating it to annual. This is a more honest approach to the limitations of the actual data you are unfortunately stuck with. $\endgroup$ Commented Apr 6, 2013 at 23:41
  • $\begingroup$ Dear @Peter Ellis, I am actually disaggregating annual to quarterly. Many thanks for your time! $\endgroup$
    – mr.rox
    Commented Apr 9, 2013 at 14:43
  • $\begingroup$ My point is that it isn't possible to disaggregate annual to quarterly. That is, there is no possible way to recreate the first of my two plots if all you have is the data for the second. Anyway, good luck with your analysis. $\endgroup$ Commented Apr 9, 2013 at 20:16
  • $\begingroup$ Yes, but seasonality will have to be removed anyway before running a regression. my disaggregated data might not have the same properties as that of original quarterly data, but it will be a seasonally adjusted version of the original quarterly data. $\endgroup$
    – mr.rox
    Commented Apr 11, 2013 at 21:51
2
$\begingroup$

There are a few methods which can disaggregate time-series but besides the original annual series you need to have a quarterly/monthly indicator series from which the seasonal cycle will be inferred.

These benchmarking and extrapolation methods try to conserve as much as possible from the quarter-to-quarter changes in new series with simultaneously having a binding constraint that the sum of four quarters is same as one value in annual series.

arg min {x} t(x)Ax such that Ra=c, where x is error between bench-marked series a and original higher frequency series b. Vector c contains annual values and R is a matrix of constraints.

$\endgroup$

Your Answer

By clicking “Post Your Answer”, you agree to our terms of service and acknowledge you have read our privacy policy.

Not the answer you're looking for? Browse other questions tagged or ask your own question.