7
$\begingroup$

I've run a path analysis using semTools. I'm interested to test indirect effects. The p values for all indirect effects were non-significant, but the Monte Carlo confidence interval for some of them did not contain zero.

My question is - is it appropriate to use only Monte Carlo confidence interval, but not p-values to report and interpret the results?

I did some search online but I'm afraid there was limited info. I saw this post: Non-significant p-values but CI does not include 0, but the answer talked about bootstrapping. In my study, I used multiple imputations to handle missing data, so bootstrapping was not appropriate.

Below are some codes showing the conflicting results. Because the codes for my model is long, I didn't show it below. I've shown the codes that are relevant to my question. Indirect effect 19 and 20 below had non-significant p values, but the Monte Carlo CI did not contain zero.

I saw some people saying that they would not trust the p-values because they are computed assuming the Z-statistic comes from a standard normal distribution (thus potentially favouring Monte Carlo CI). But I also saw some people saying that the p values and CI (not specific to Monte Carlo though) should be consistent with each other. If they are not consistent, I should not reject the null hypothesis. Can anyone please shed some light on this?

output <- runMI(model, data=data3c.mi.1, fun="sem", estimator = "MLR", se = "robust.huber.white")


                Estimate   Std.Err  t-value     df  P(>|t|) ci.lower ci.upper   Std.lv  Std.all
indirect19        0.118    0.074    1.593 1563.011    0.111   -0.027    0.264    0.119    0.008
indirect20        0.090    0.055    1.639 1924.600    0.101   -0.018    0.198    0.091    0.009
indirect21        0.146    0.126    1.152  714.059    0.250   -0.102    0.393    0.147    0.010
indirect22        0.112    0.097    1.147  664.112    0.252   -0.080    0.303    0.112    0.011

monteCarloCI(output, standardized = TRUE)

                           est ci.lower ci.upper
indirect19              0.119    0.001    0.297
indirect20              0.091    0.001    0.215
indirect21              0.147   -0.059    0.393
indirect22              0.112   -0.044    0.303
$\endgroup$

3 Answers 3

10
$\begingroup$

P-values and confidence interval extremes are functions of the data and the statistical models used in their calculation. That means that it is wrong to expect that a p-value from one method will 'agree' with the confidence interval from another.

Your results suggest that you have weak evidence that the null hypothesis is false according to both methods. Slightly weaker according to the model that you used to generate p-values than according to the model that gave you intervals.

$\endgroup$
2
  • $\begingroup$ Thank you Michael! Would you suggest reporting only the Monte Carlo results or the results from both p values and Monte Carlo CI? $\endgroup$
    – Dale
    Commented Jun 12 at 0:36
  • 1
    $\begingroup$ No, I recommend reporting all of it and making thoughtful suggestions of how to extend your work. $\endgroup$ Commented Jun 12 at 21:06
10
$\begingroup$

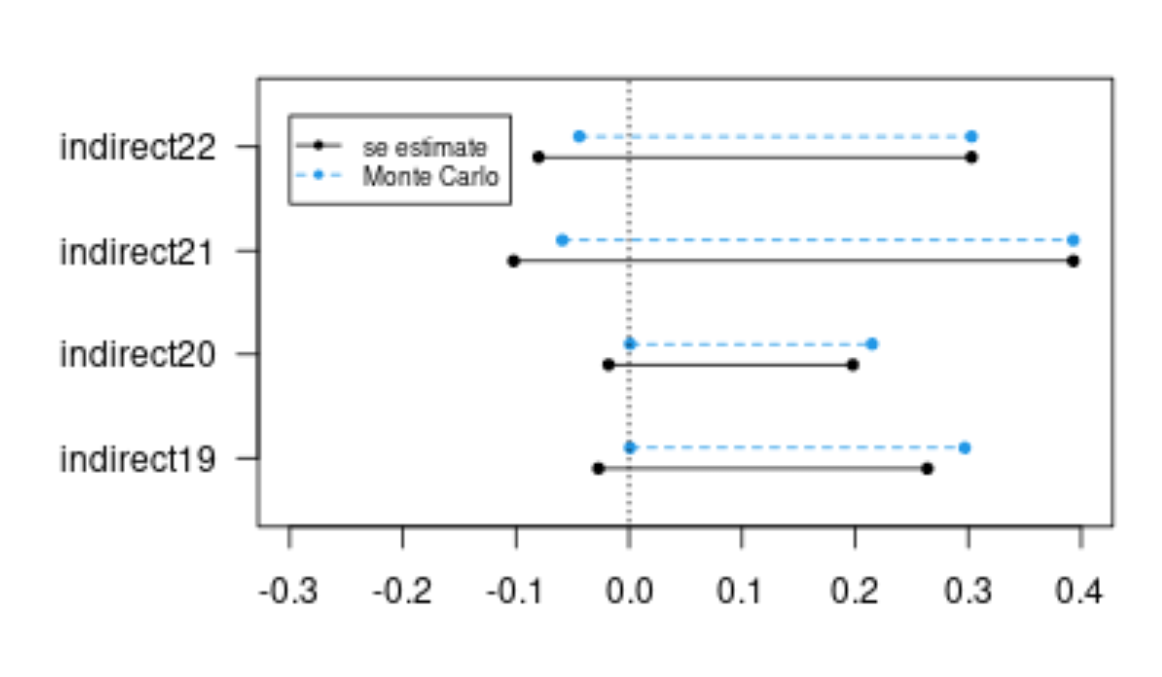
Make a plot, and see that these confidence intervals are very much like each other.

plot for comparison

So the two features 'indirect19' and 'indirect20' are border cases. This makes the question not only about which method is best (and all sort of details about both methods which are estimations and not exact, thus likely to slightly differ), but it also opens up the can of worms about p-values at the border of a predefined significance level (e.g. Is the exact value of a 'p-value' meaningless? or Is it wrong to refer to results as "nearly" or "somewhat" significant?).

The appropriateness of reporting only one set of (convenient) p-values... In this specific case it doesn't really have much influence, but that practice is generally not very good. It can be considered p-hacking. People perform some experiment and, when the result is not very accurate, instead of gathering more data to be more sure, they try out many different statistical tricks to make the results look better than they really are.

It is better to just report everything that you did and represent the data for what it is, without cherry picking regarding p-values. If it is not very significant then it is just not significant. In the end, what matters is actually the effect size, and significance is just a measure of the precision in the experiment.

Also, be clear why you performed multiple tests. If you were not sure about what method is appropriate, then do not just report only a single one when the conclusions about significance suit you better. The difference in significance is not what makes the one method better than the other. If you couldn't decide which statistical method to use before doing the analysis, then you can neither after having performed the calculations. (you might figure out too later, after seeing the results that one method happened to be more powerful, but it is a slippery slope to decide afterwards based on the observed power)

$\endgroup$
7
$\begingroup$

The normal-theory CIs in summary() are consistent with the normal-theory p values in summary(). The monteCarloCI() method makes less restrictive assumptions, so it is more defensible (see the reference on the help page). Not that it honestly makes a big practical difference. The CIs that do not contain 0 do contain .001 (which is nearly 0), so you can't reject that null hypotheses either.

FYI, you should use estimator="MLM". It is more efficient than MLR, which is only advantageous when you have missing data and use FIML estimation. The whole point of multiple imputation is to be able to use complete-data methods.

$\endgroup$
2
  • $\begingroup$ Hi Terrence, thank you for the explanation and suggestion. I greatly appreciate your help! My data was not normally distributed, so I used MLR. But my data has 'complete data' after implementing multiple imputations. In this case, would you still recommend using MLM? $\endgroup$
    – Dale
    Commented Jun 12 at 7:06
  • $\begingroup$ Yes, MLM is the shortcut for a nonnormality correction. MLR is too, but using a diffferent method that cooperates with FIML estimation of incomplete data. As I said, MLM is more efficient. $\endgroup$
    – Terrence
    Commented Jun 12 at 9:58

Your Answer

By clicking “Post Your Answer”, you agree to our terms of service and acknowledge you have read our privacy policy.

Not the answer you're looking for? Browse other questions tagged or ask your own question.