I'm struggling to develop a deep intuition for why monotonic transformations preserve relative probabilities in continuous cases. While I understand the idea at a surface level, particularly for discrete cases (where it's easier to think in terms of counts), I lose my intuition when trying to extend this to continuous distributions.
I think I understand the following so far:
- A monotonic transformation $f(x)$ (e.g., $f(x) = x^2$ on $x \geq 0$) preserves the order of outcomes. If $x_1 < x_2$, then $f(x_1) < f(x_2)$.
- In discrete cases, this order preservation combined with the one-to-one nature of the mapping helps me see why relative probabilities don’t change—the counts remain proportional, even though the values are transformed.
- In continuous cases, the probability density function (PDF) changes according to the derivative of the transformation: $$p_Y(y) = p_X(f^{-1}(y)) \cdot \left| \frac{d}{dy} f^{-1}(y) \right|,$$ where $f^{-1}(y)$ is the inverse of $f(x)$. But I’m having trouble connecting this formula to an intuitive/visual understanding of why relative probabilities over intervals remain unchanged.
Where I get stuck:
- For transformations like $f(x) = x^2$, which stretches the input space non-uniformly (e.g., $1 \to 1, 2 \to 4, 10 \to 100$), it feels like the larger values might disproportionately dominate the probability. For example, the interval $[10, 11]$ maps to $[100, 121]$, which is much larger than $[1, 2] \to [1, 4]$.
- My intuition breaks down because I struggle to reconcile how the adjustment by the derivative $\frac{1}{f'(x)}$ (or $\frac{1}{2\sqrt{y}}$ for $f(x) = x^2$) "balances" this stretching effect. In a discrete case i can imagine the one to one mapping as simple a relabelling where relative counts stay the same. But for the continuous case i can't find the same satisfaction.
What I’d like to understand:
- How does the change-of-variables formula ensure that relative probabilities (e.g., $P(Y \in [a, b]) / P(Y \in [c, d])$) are preserved under monotonic transformations? Is there a way to build intuition for this beyond just trusting the formula?
- How should I think about this transformation geometrically? Does it help to think of probabilities as "density mass" that gets redistributed, and if so, why does this redistribution not distort the relative sizes?
- Are there specific examples or visualisations that might help bridge my intuition gap, particularly for continuous distributions?
Thank you for any insights!
Update
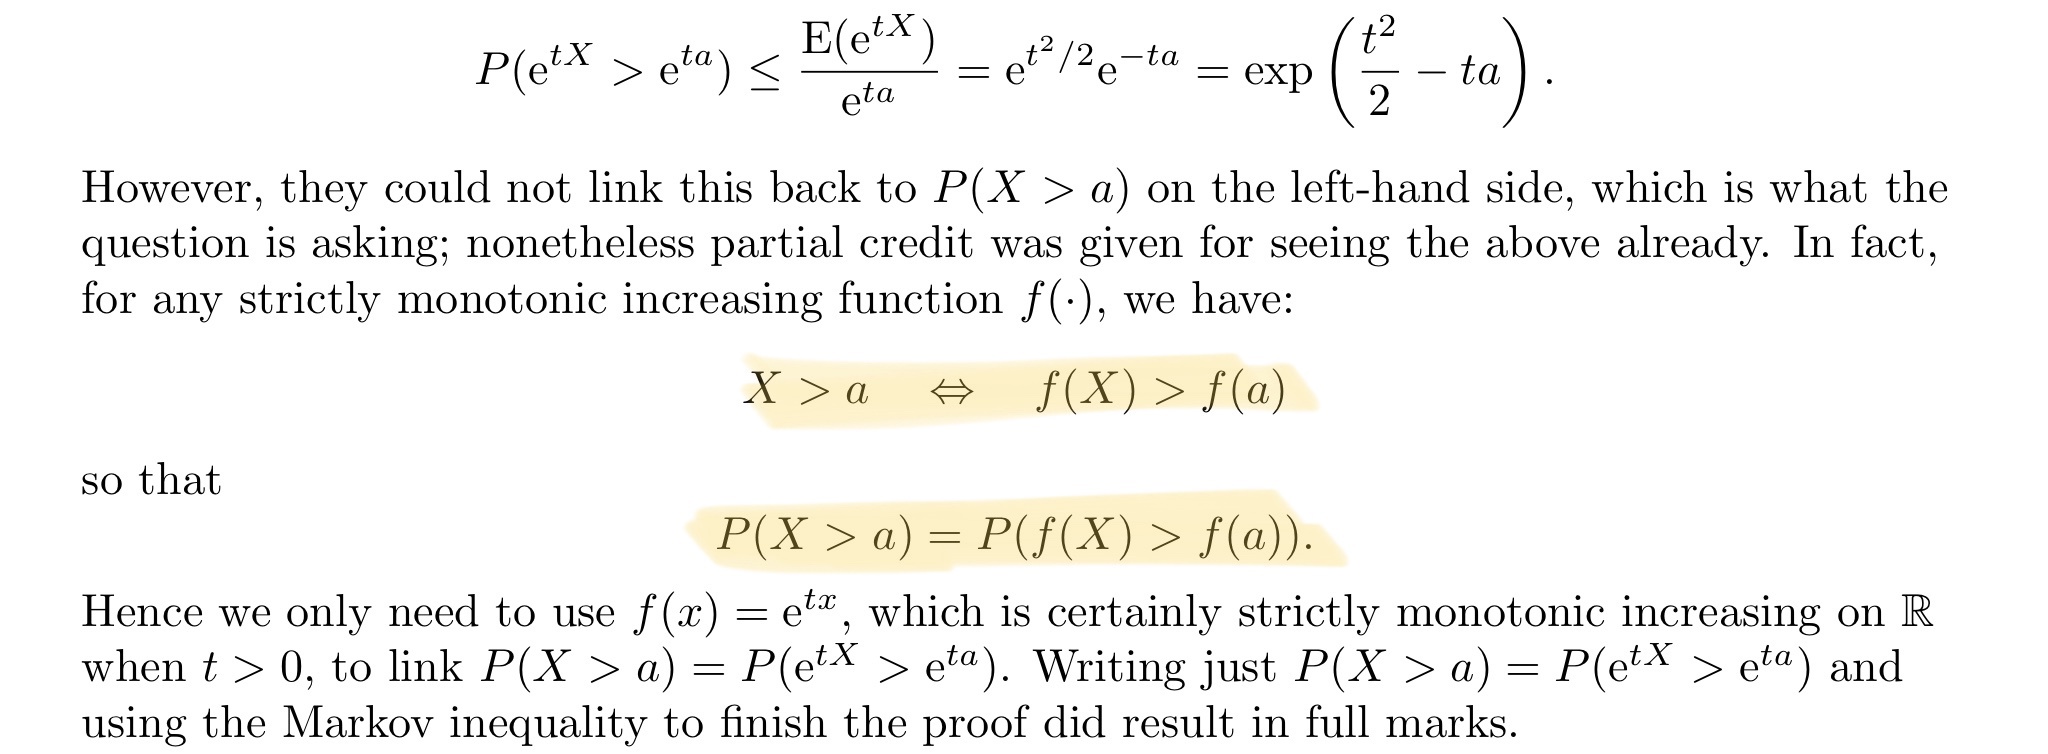
As Whuber kindly pointed out my initial assumption/question is wrong which is maybe why it is confusing me. I have attached bellow a reference I was clearly misinterpreting to arrive at this conclusion. Thoughts still very much appreciated.

