3
$\begingroup$

I am working with the Boston data set in R.

I have read that random forest should be able to deal with untransformed data. In my example I do a log transformation of the dependent variable. My variance explained goes from 54% to 94%.

Here is what the original dependent variable looks like. enter image description here
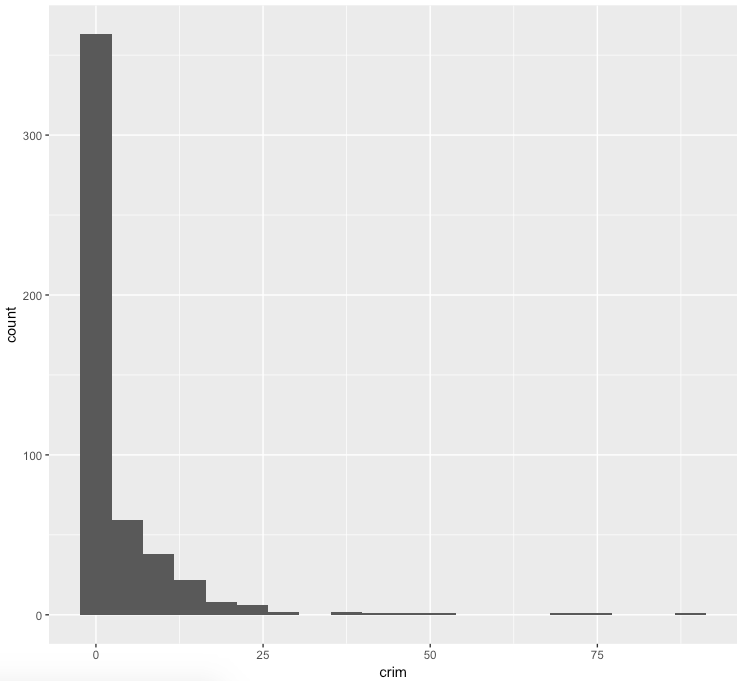
I run a random forest model without any transformation to the data set. Our dependent variable is crim.

library(randomForest)
randomForest(crim ~., Boston)
#variance explained is 54%

Once I do a log transformation of crim(to make the distro more normal) the variance explained jumps to 95%!!

randomForest(log(crim) ~., Boston)
#variance explained is 95%

Since this is a monotonic transfromation. I did not think it would have an impact on a tree based model. Can someone provide some intuition on why this might be the case? Thank you

$\endgroup$
1
  • $\begingroup$ I think its more to do with variance explained score you are using. consider using an arc tan transformation I suspect your variance explained will become even better ( because your transformed variable is now bounded). you have to retransform the data back and then calculate the variance explained. Though this is not as straightforward as you imagine. see duan smearing estimator. $\endgroup$
    – seanv507
    Commented Jul 5, 2019 at 17:02

1 Answer 1

3
$\begingroup$

It doesn't matter that the random forest model happens to be built from a collection of binary tree splits. In your examples, the first random forest model makes predictions in the original scale and the second in a log-transformed scale. Whether the predicted values are obtained from a standard linear regression or a random forest regression, the issue is how close the predictions come to the actual values in the scale of the transformation used in the model.

As this answer says, the "percent variance explained" is 100 times the pseudo-$R^2$ from the random forest regression model. As this answer shows, that pseudo-$R^2$ is given by: $$ R^2 = 1 - \frac{\sum_i (y_i - \hat{y}_i)^2}{\sum_i (y_i - \bar{y})^2} . $$

where $y_i$ are the observations, $\hat y_i$ are the predicted values, and $\bar y$ is the mean of the observations.

So if a transformation brings the predicted values $\hat y_i$ relatively closer to the observations $y_i$ in the transformed scale over what was seen in the original scale, the $R^2$ and the "percent variance explained" will be higher in the transformed scale.

$\endgroup$
4
  • $\begingroup$ Thanks EdM for the links and explanation! So would it make sense, to always try a few transformations even with a tree based method? $\endgroup$ Commented Jul 6, 2019 at 15:01
  • $\begingroup$ @JordanWrong the issue, as implied in a comment on your original question, is the scale in which you want to minimize the prediction error. Your second example shows the error in the log-transformed scale. If you care about prediction in the original scale of measurement, then you need to back-transform to the original scale. The "percent variance explained" after back-transformation from another scale might or might not be better than for a tree trained in the original scale. $\endgroup$
    – EdM
    Commented Jul 6, 2019 at 15:18
  • $\begingroup$ ahhh, that makes great sense. Thanks EdM $\endgroup$ Commented Jul 6, 2019 at 15:24
  • $\begingroup$ The pseudo-R2 showed above is, in other words, 1 - (MSE / Var[y]) $\endgroup$
    – igorkf
    Commented Sep 18, 2020 at 16:38

Your Answer

By clicking “Post Your Answer”, you agree to our terms of service and acknowledge you have read our privacy policy.

Not the answer you're looking for? Browse other questions tagged or ask your own question.