Yes multivariate linear re-combinations of variables do affect the possible RF model structure. One could e.g. include the first principal component(PCA) as new feature before training, though certainly not guaranteed to improve model performance. But linear combinations can in some occasions increase the cross validated prediction performance. RF models do fit interactions, but not very efficiently. A tree model interpolate in feature space parallel(not diagonal) to any feature axis.
Conventional tree models only split by one feature, thus a split in feature space is parallel to this feature and orthogonal to every other feature. With a linear recombination you allow to make splits in the old feature space in a new direction, if this new direction happens to align with a steep gradient of a strong interaction, your RF model can reduce its bias.
More general rotation forest rotate partly randomly partly with PCA the entire coordinate system of the feature space before growing each tree. Rotation forest can fit $y=x1*x2*x3*x4$ which is nearly impossible for regular RF, but so can various boosting algorithms. I wrote a RF-variant, which would besides regular features, also try random rotations of features in each node. Successful random rotations was inherited by daughter nodes. The variant was better than RF for complex low noise structures, but not better then gradient boosting machine etc. PPforest use linear discriminant analysis to rotate inside each node. If the data structure consist of nice additive main effects, it is a bad idea to rotate the feature space. Then, main effects will degrade to interaction effects.

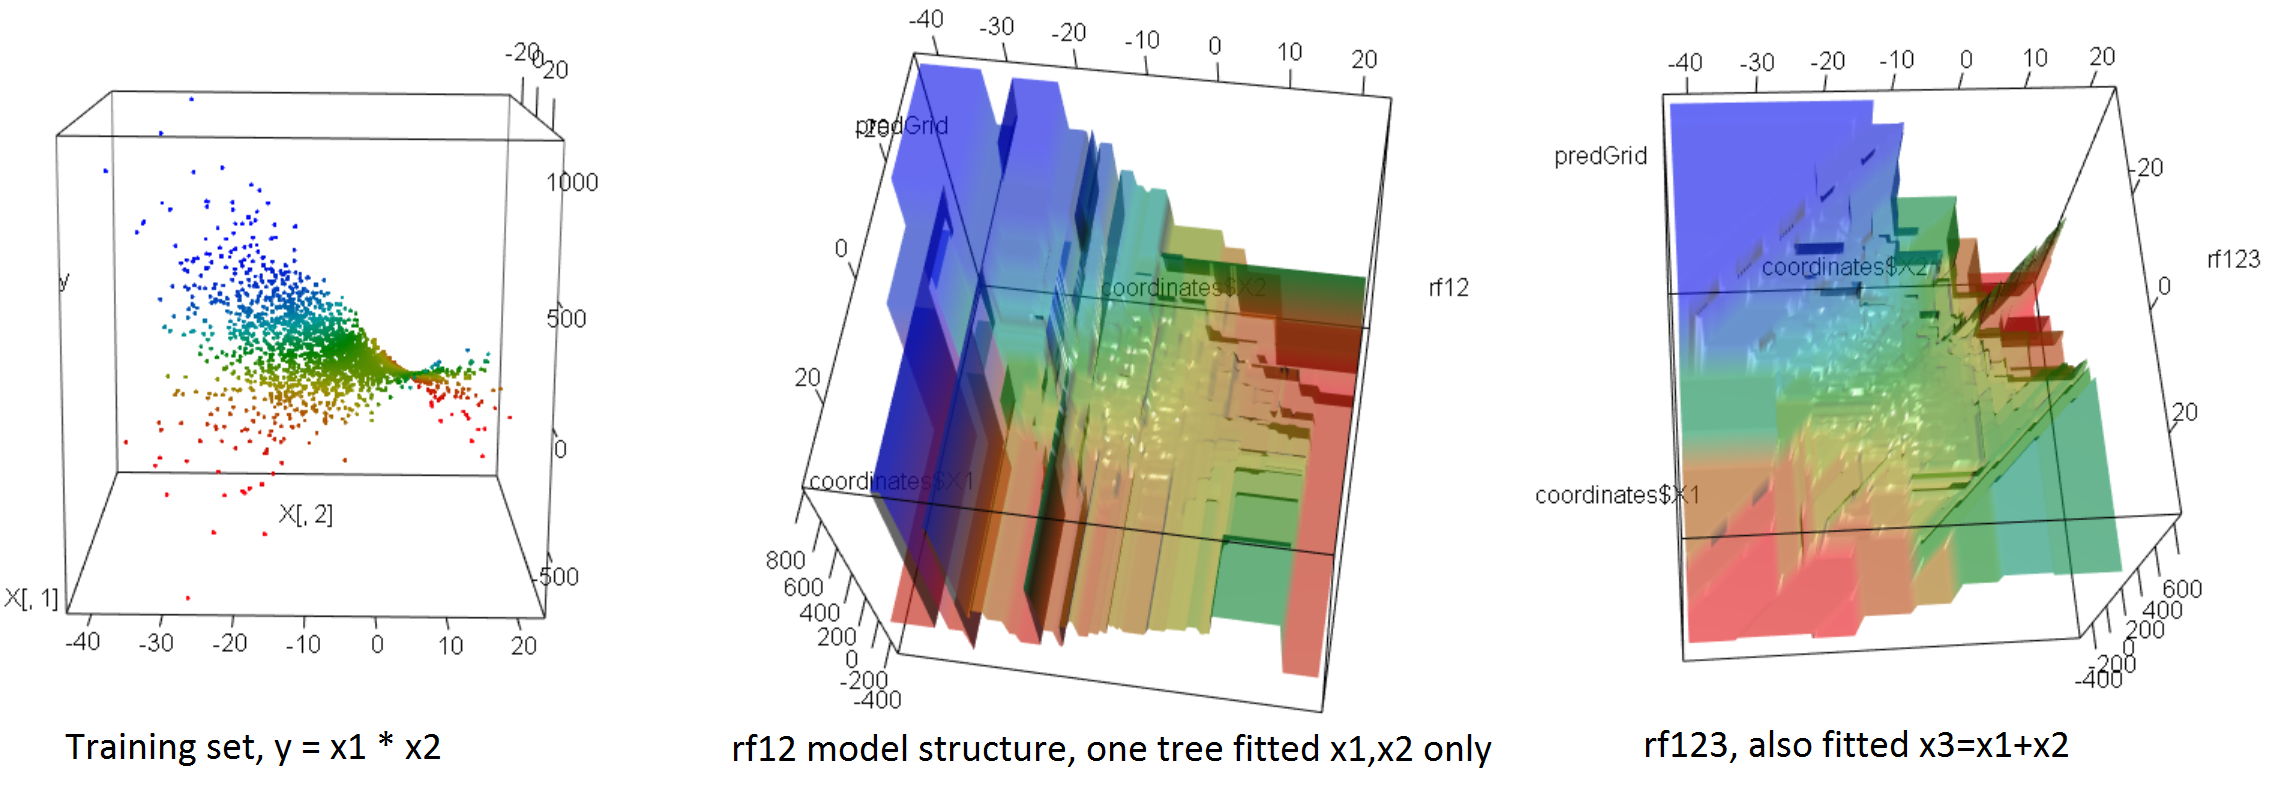
To illustrate I made an simulation. 2000 points drawn from $y=x_1*x_2$. RF can fit this structure, but not without some bias. Including an extra variable $x_3=x_1+x_2$ allow what seems as diagonal splits in the original feature space. Notice diagonol splits in right decision tree model(rf123), whereas no diagonal split in middle plot(rf12)
library(randomForest)
library(forestFloor)
library(rgl)

#make data
X  = data.frame(replicate(2,10*(rnorm(2000)-.7)))
y = X[,1]*X[,2]
X[,3] = X[,1] + X[,2] # X3 is a derived variable

#plot the data structure
plot3d(X[,1],X[,2],y,col=fcol(as.matrix(y)))

#train model with/without derived X3, only one tree
rf12  = randomForest(X[,1:2],y,ntree=1)
rf123 = randomForest(X[,1:3],y,ntree=1)

#make plotter function
plotSurf = function(model,X,i.var=1:2,gridLines=150,...) {
  ranges =lapply(X[,i.var],range)
  coordinates = lapply(ranges,function(x) seq(x[1],x[2],le=gridLines))
  Xgrid = data.frame(expand.grid(coordinates))
  Xgrid$X3 = apply(Xgrid,1,sum) # reconstruct helper variable
  names(Xgrid) = names(X)
  predGrid =predict(model,Xgrid)
  persp3d(x = coordinates$X1,
          y = coordinates$X2,
          z = predGrid,
          col = fcol(as.matrix(predGrid)),
          ,...)
}

plotSurf(rf12 ,X,main="rf12",alpha=.6)
open3d()
plotSurf(rf123,X,main="rf123",alpha=.6)

