(To make our notions a little more precise, let's call the 'test statistic' the distribution of the thing we look up to actually compute the p-value. This means that for a two-tailed t-test, our test statistic would be $|T|$ rather than $T$.)
What a test statistic does is induce an ordering on the sample space (or more strictly, a partial ordering), so that you can identify the extreme cases (the ones most consistent with the alternative).
In the case of Fisher's exact test, there's already an ordering in a sense - which are the probabilities of the various 2x2 tables themselves. As it happens, they correspond to the ordering on $X_{1,1}$ in the sense that either the largest or smallest values of $X_{1,1}$ are 'extreme' and they are also the ones with smallest probability. So rather than look at the values of $X_{1,1}$ in the way you suggest, one can simply work in from the large and small ends, at each step just adding whichever value (the largest or smallest $X_{1,1}$-value not already in there) has the smallest probability associated with it, continuing until you reach your observed table; on its inclusion, the total probability of all those extreme tables is the p-value.
Here's an example:

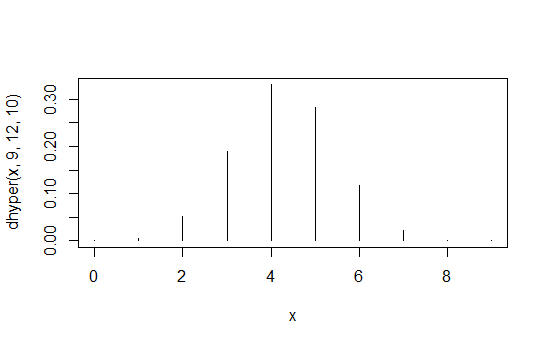
> data.frame(x=x,prob=dhyper(x,9,12,10),rank=rank(dhyper(x,9,12,10)))
   x         prob rank
1  0 1.871194e-04    2
2  1 5.613581e-03    4
3  2 5.052223e-02    6
4  3 1.886163e-01    8
5  4 3.300786e-01   10
6  5 2.829245e-01    9
7  6 1.178852e-01    7
8  7 2.245433e-02    5
9  8 1.684074e-03    3
10 9 3.402171e-05    1
The first column are $X_{1,1}$ values, the second column are the probabilities and the third column is the induced ordering.
So in the particular case of the Fisher exact test, the probability of each table (equivalently, of each $X_{1,1}$ value) can be considered the actual test statistic.
If you compare your suggested test statistic $|X_{1,1}-\mu|$, it induces the same ordering in this case (and I believe it does so in general but I have not checked), in that larger values of that statistic are the smaller values of the probability, so it could equally be considered 'the statistic' - but so could many other quantities -- indeed any that preserve this ordering of the $X_{1,1}$s in all cases are equivalent test statistics, because they always produce identical p-values.
Also note that with the more precise notion of 'test statistic' introduced at the start, none of the possible test statistics for this problem actually has a hypergeometric distribution; $X_{1,1}$ does, but it's not actually a suitable test statistic for the two tailed test (if we did a one-sided test where only more association in the main diagonal and not in the second diagonal was regarded as consistent with the alternative, then it would be a test statistic). This is just the same one-tailed/two-tailed issue I began with.
[Edit: some programs do present a test statistic for the Fisher test; I'd presume this would be a -2logL type calculation that would be asymptotically comparable with a chi-square. Some may also present the odds-ratio or its log but that's not quite equivalent.]

