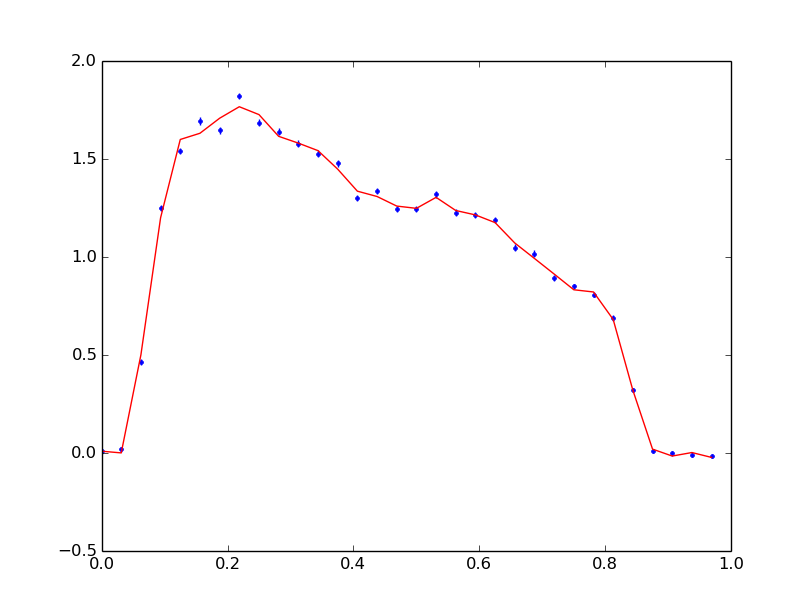
If I understand correctly (and please correct me if I am wrong), we have a stochastic process, that exhibits a well-defined "seasonality" (the orbital phase cycle -OPC). We count photons as the orbital phase evolves (hopefully in the same time intervals and of equal length). Then we chop the process into pieces, each piece of exactly the same length (one full OPC), we "stack" the pieces together, and calculate their average... and we want to test whether each piece (individual profile) is "statistically different" to this average you calculated.
The problem is, we don't know why the OP wants to do that. I am writing this to qualify what will come below -because it may prove useless to the OP.
When we treat a stochastic process like this, then, in order for such averaging calculations to be meaningful, it must be the case that the process exhibits stationarity and/or ergodicity (here in a seasonal/periodic sense, namely, that the process repeats itself stochastically in each OPC). Otherwise, this average profile is meaningless.
So if what I am describing is a correct translation of the case in question, then, testing single sets of process realizations (individual profiles) against the average, is not the way to go. One should test first for stationarity of the process, taking into account its periodic nature.
A simple way to do this is the following: Denote the instances of counts inside OPC $i$ by $C_{1i},C_{2i},...,C_{Ti}$ where $i=1,...,N$. Then take the same count-instance from each OPC and create a time series
$$\{C_{11}, C_{12},...,C_{1N}\},\;\; \text{...,} \;\;\{C_{T1}, C_{T2},...,C_{TN}\}$$
These time series have "by-passed" the periodic nature of the process. If these time series are stationary, then the whole process is seasonally stationary, repeating itself in each OPC.
This approach will also permit to detect perhaps other trends, or temporary phenomena, in your data. Even by visual inspection one could detect shifts or increased variability, and then, if these phenomena happen for the same bunch of $i$'s inside each time series (i.e. for the same OPC's), we will have found a period in the evolution of the process where something has happened, out of the "ordinary".
Assume now we found to our satisfaction that the process is OPC-stationary. Then creating the average profile is meaningful:
$$\{\bar C_{1\cdot}, \bar C_{2\cdot},..., \bar C_{T\cdot}\}$$
Since we have accepted stationarity, this is a series that includes "good approximations" to the expected value of the process in each count instance inside an OPC. Each instance inside an OPC may be governed by a different distribution. The average profile contains estimates of the mean values of these distributions.
Can we now go back to the original question? Can we compare the individual profiles against the average? What we would be comparing here?
As said, the average profile is a series of mean values of underlying distributions. Each individual profile is a series containing realizations of these same distributions (per count instance). And we do not test whether a realization of a random variable is "statistically different" from its own expected value, do we?
Let alone the fact that by the look of it, each count instance inside an OPC is not characterized by the same distribution (mean values certainly look different). So a whole OPC cannot be viewed as data coming from the same distribution (it may come from the same family of course). Then, tests that were created to compare two sets of values each coming from a distribution, in order to test whether they come from the same distribution after all, are not relevant here, since each set of values separately does not come from one distribution to begin with. This makes questionable any such comparison between two individual profiles also.
Another answer provided a likelihood approach that is valid in that direction, through the use of a joint distribution of Poissons that permits differences in moments (of course it is valid only if the process is OPC stationary, and so averaging to obtain estimates for the $\lambda_i$s is valid).
But measuring somehow directly the "overall distance" between the average profile and each individual profile, if it tells us something, is how strong was the variability contained in this specific individual profile compared to the average profile. It would not be a "reject/not reject" statistical test of distributional similarity.

