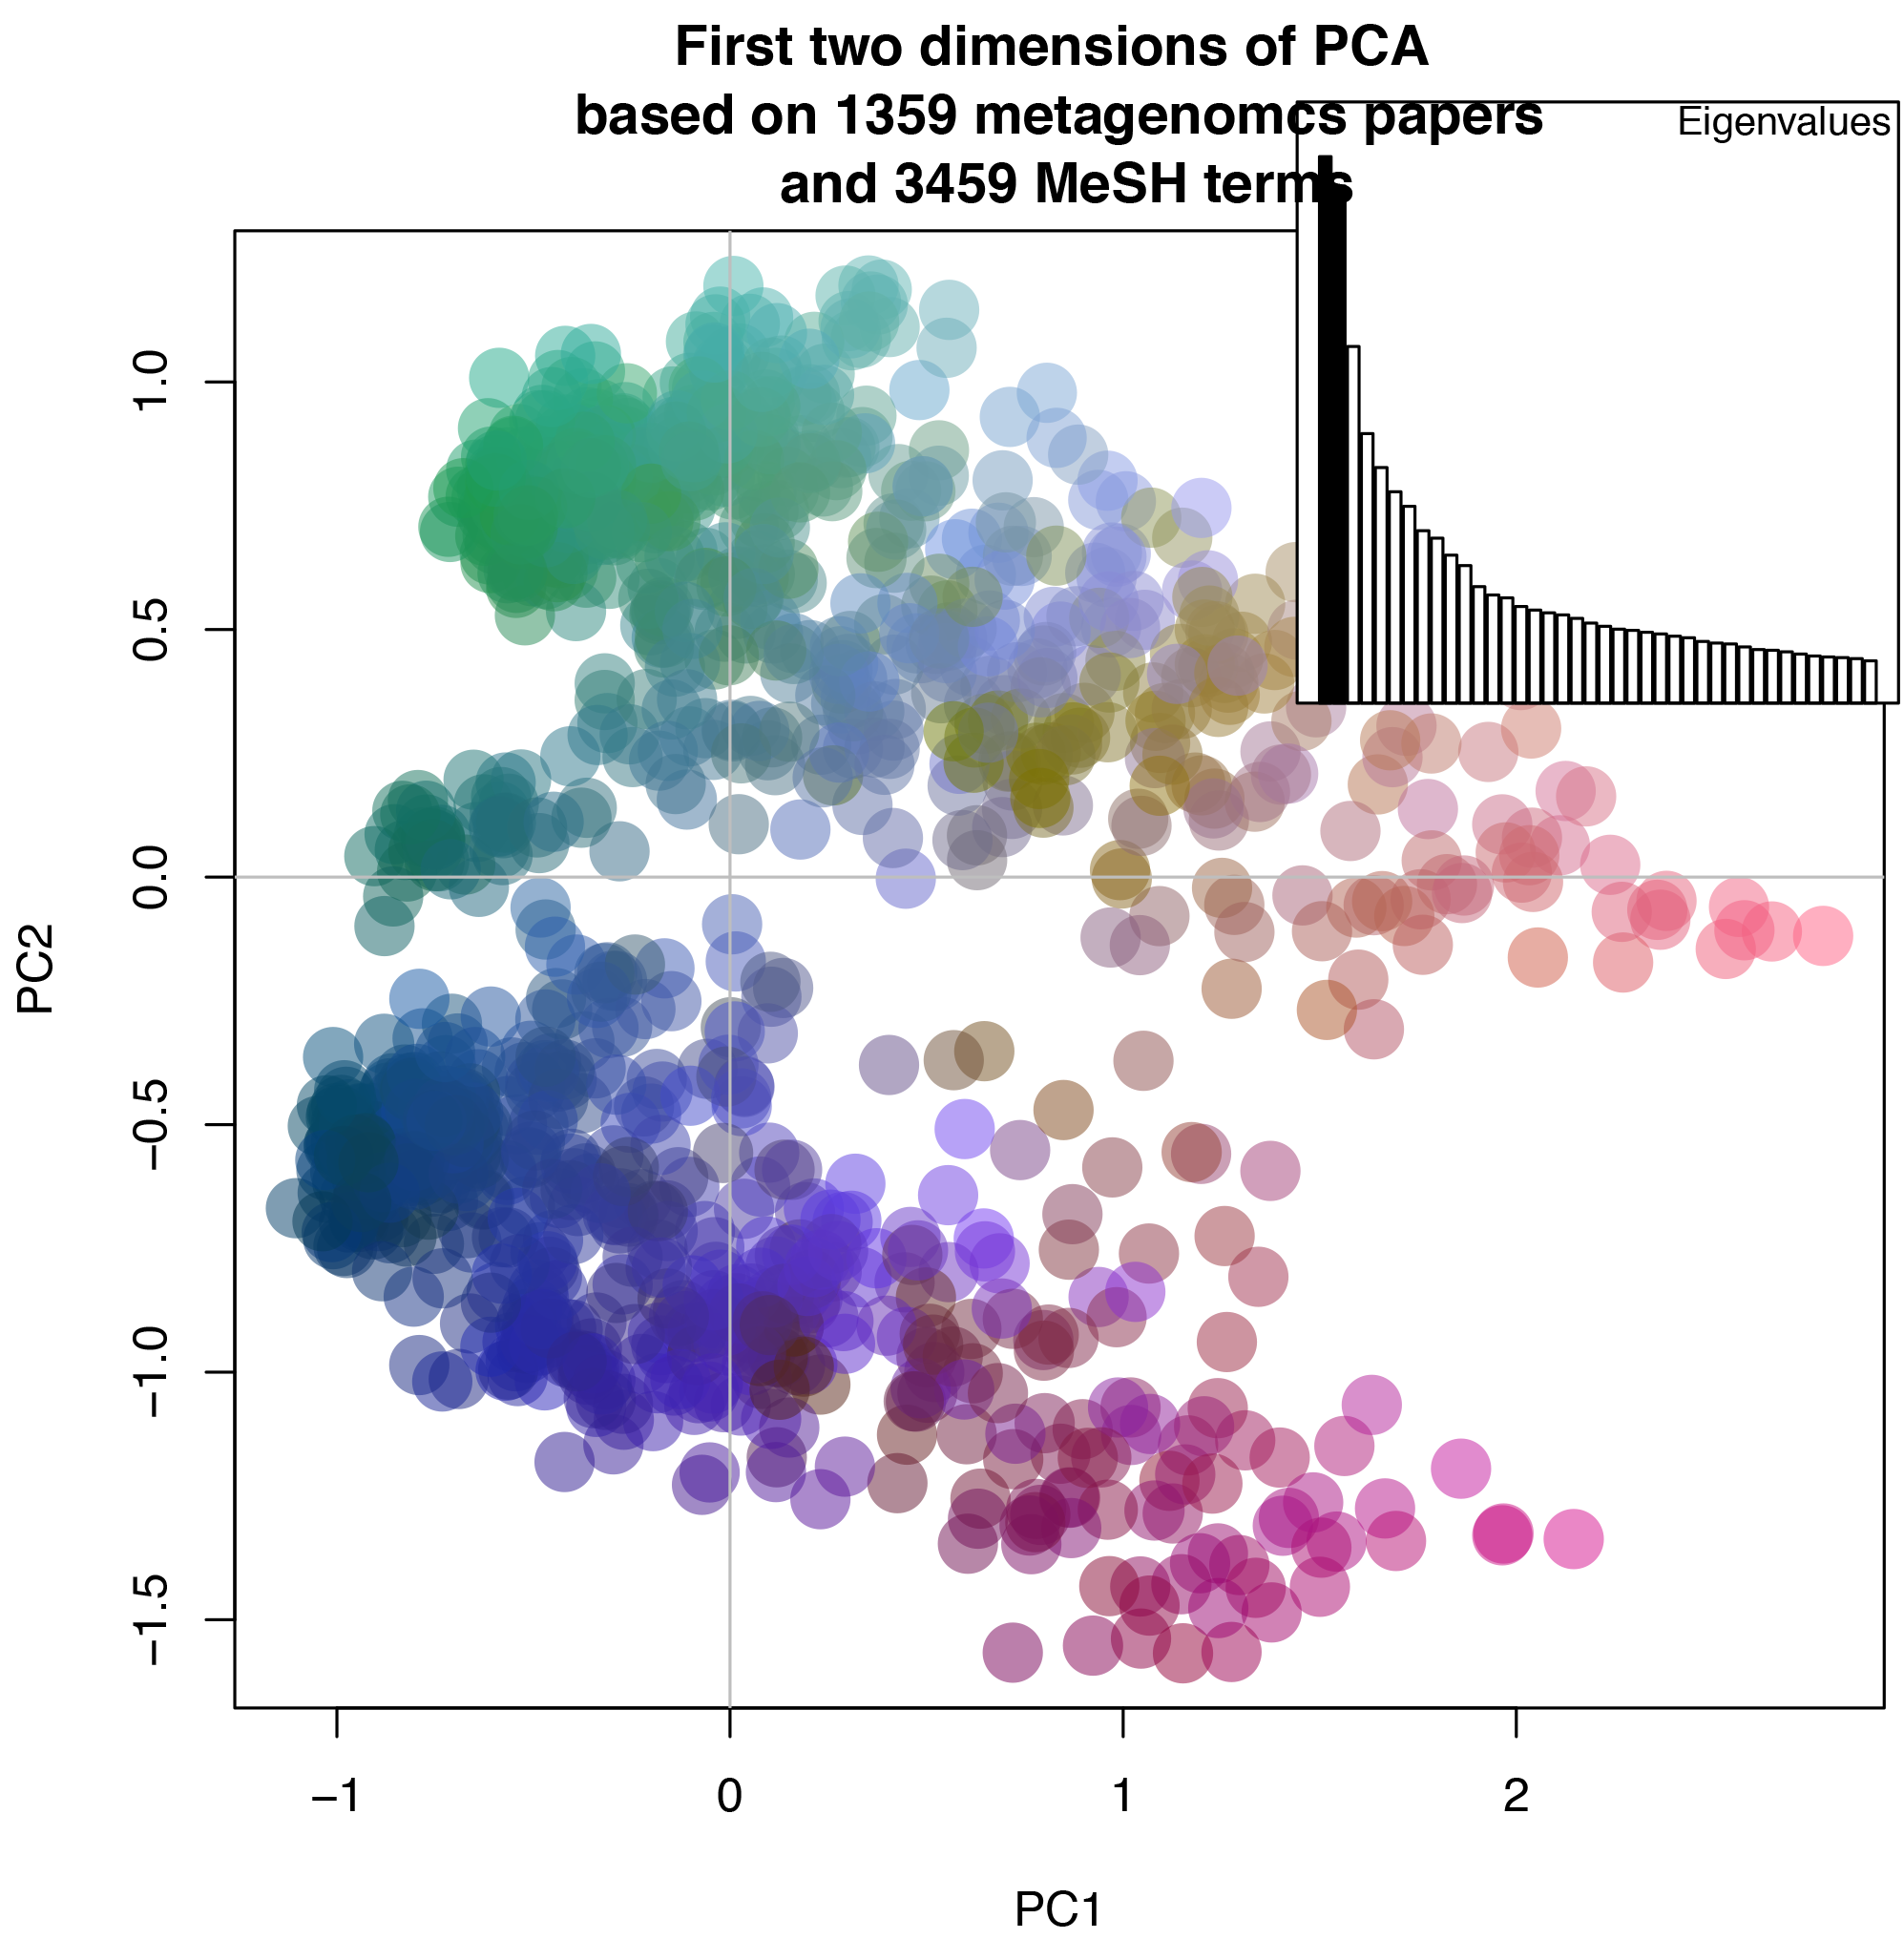
I would like to get the most important variables from a PCA result. I see two clusters in the plot. I now that is possible that there is no only one variable causing this, so maybe I would have to get more than one variable.
I'm using "Adegenet" R package. My original data is a matrix where rows are PubMed papers and columns are MeSH keywords. Data has been transformed into SNP-like to adapt the method to the new input data. Please point me the the correct R package if you think I'm doing the incorrect work with this package, I just chose it because I already knew how it works.

#R code
library(adegenet)
#Load SNPs
myPath <- "pubmed_result_metagenomics_ALL_parsed.fasta"#core SNPs retrieved with kSNP from 188 H. parasuis strains, removing from the analysis the strains tagged with ‘NK’ phenotype. kSNP k-mer sizes tested were 25, 20 and 15, selecting the run that gave more SNPs, i.e., 15.
core_SNPs_matrix <- fasta2genlight(myPath, chunk=1000, multicore=FALSE)#
core_SNPs_matrix <- as.matrix(core_SNPs_matrix)

# Principal Component Analysis (PCA)
pca1 <- glPca(core_SNPs_matrix) # 10 components saved
pca1

# Draw PCA colorplot
myCol <- colorplot(pca1$scores,pca1$scores, transp=TRUE, cex=4)
abline(h=0,v=0, col="grey")
add.scatter.eig(pca1$eig[1:40],2,1,2, posi="topright", inset=.05, ratio=.3)
title("First two dimensions of PCA \n based on 1359 metagenomcs papers \n and 3459 MeSH terms")
dev.copy2pdf(file = "Figure_12.pdf") #Save as .pdf#
