5
$\begingroup$

I would like to get the most important variables from a PCA result. I see two clusters in the plot. I now that is possible that there is no only one variable causing this, so maybe I would have to get more than one variable.

I'm using "Adegenet" R package. My original data is a matrix where rows are PubMed papers and columns are MeSH keywords. Data has been transformed into SNP-like to adapt the method to the new input data. Please point me the the correct R package if you think I'm doing the incorrect work with this package, I just chose it because I already knew how it works.
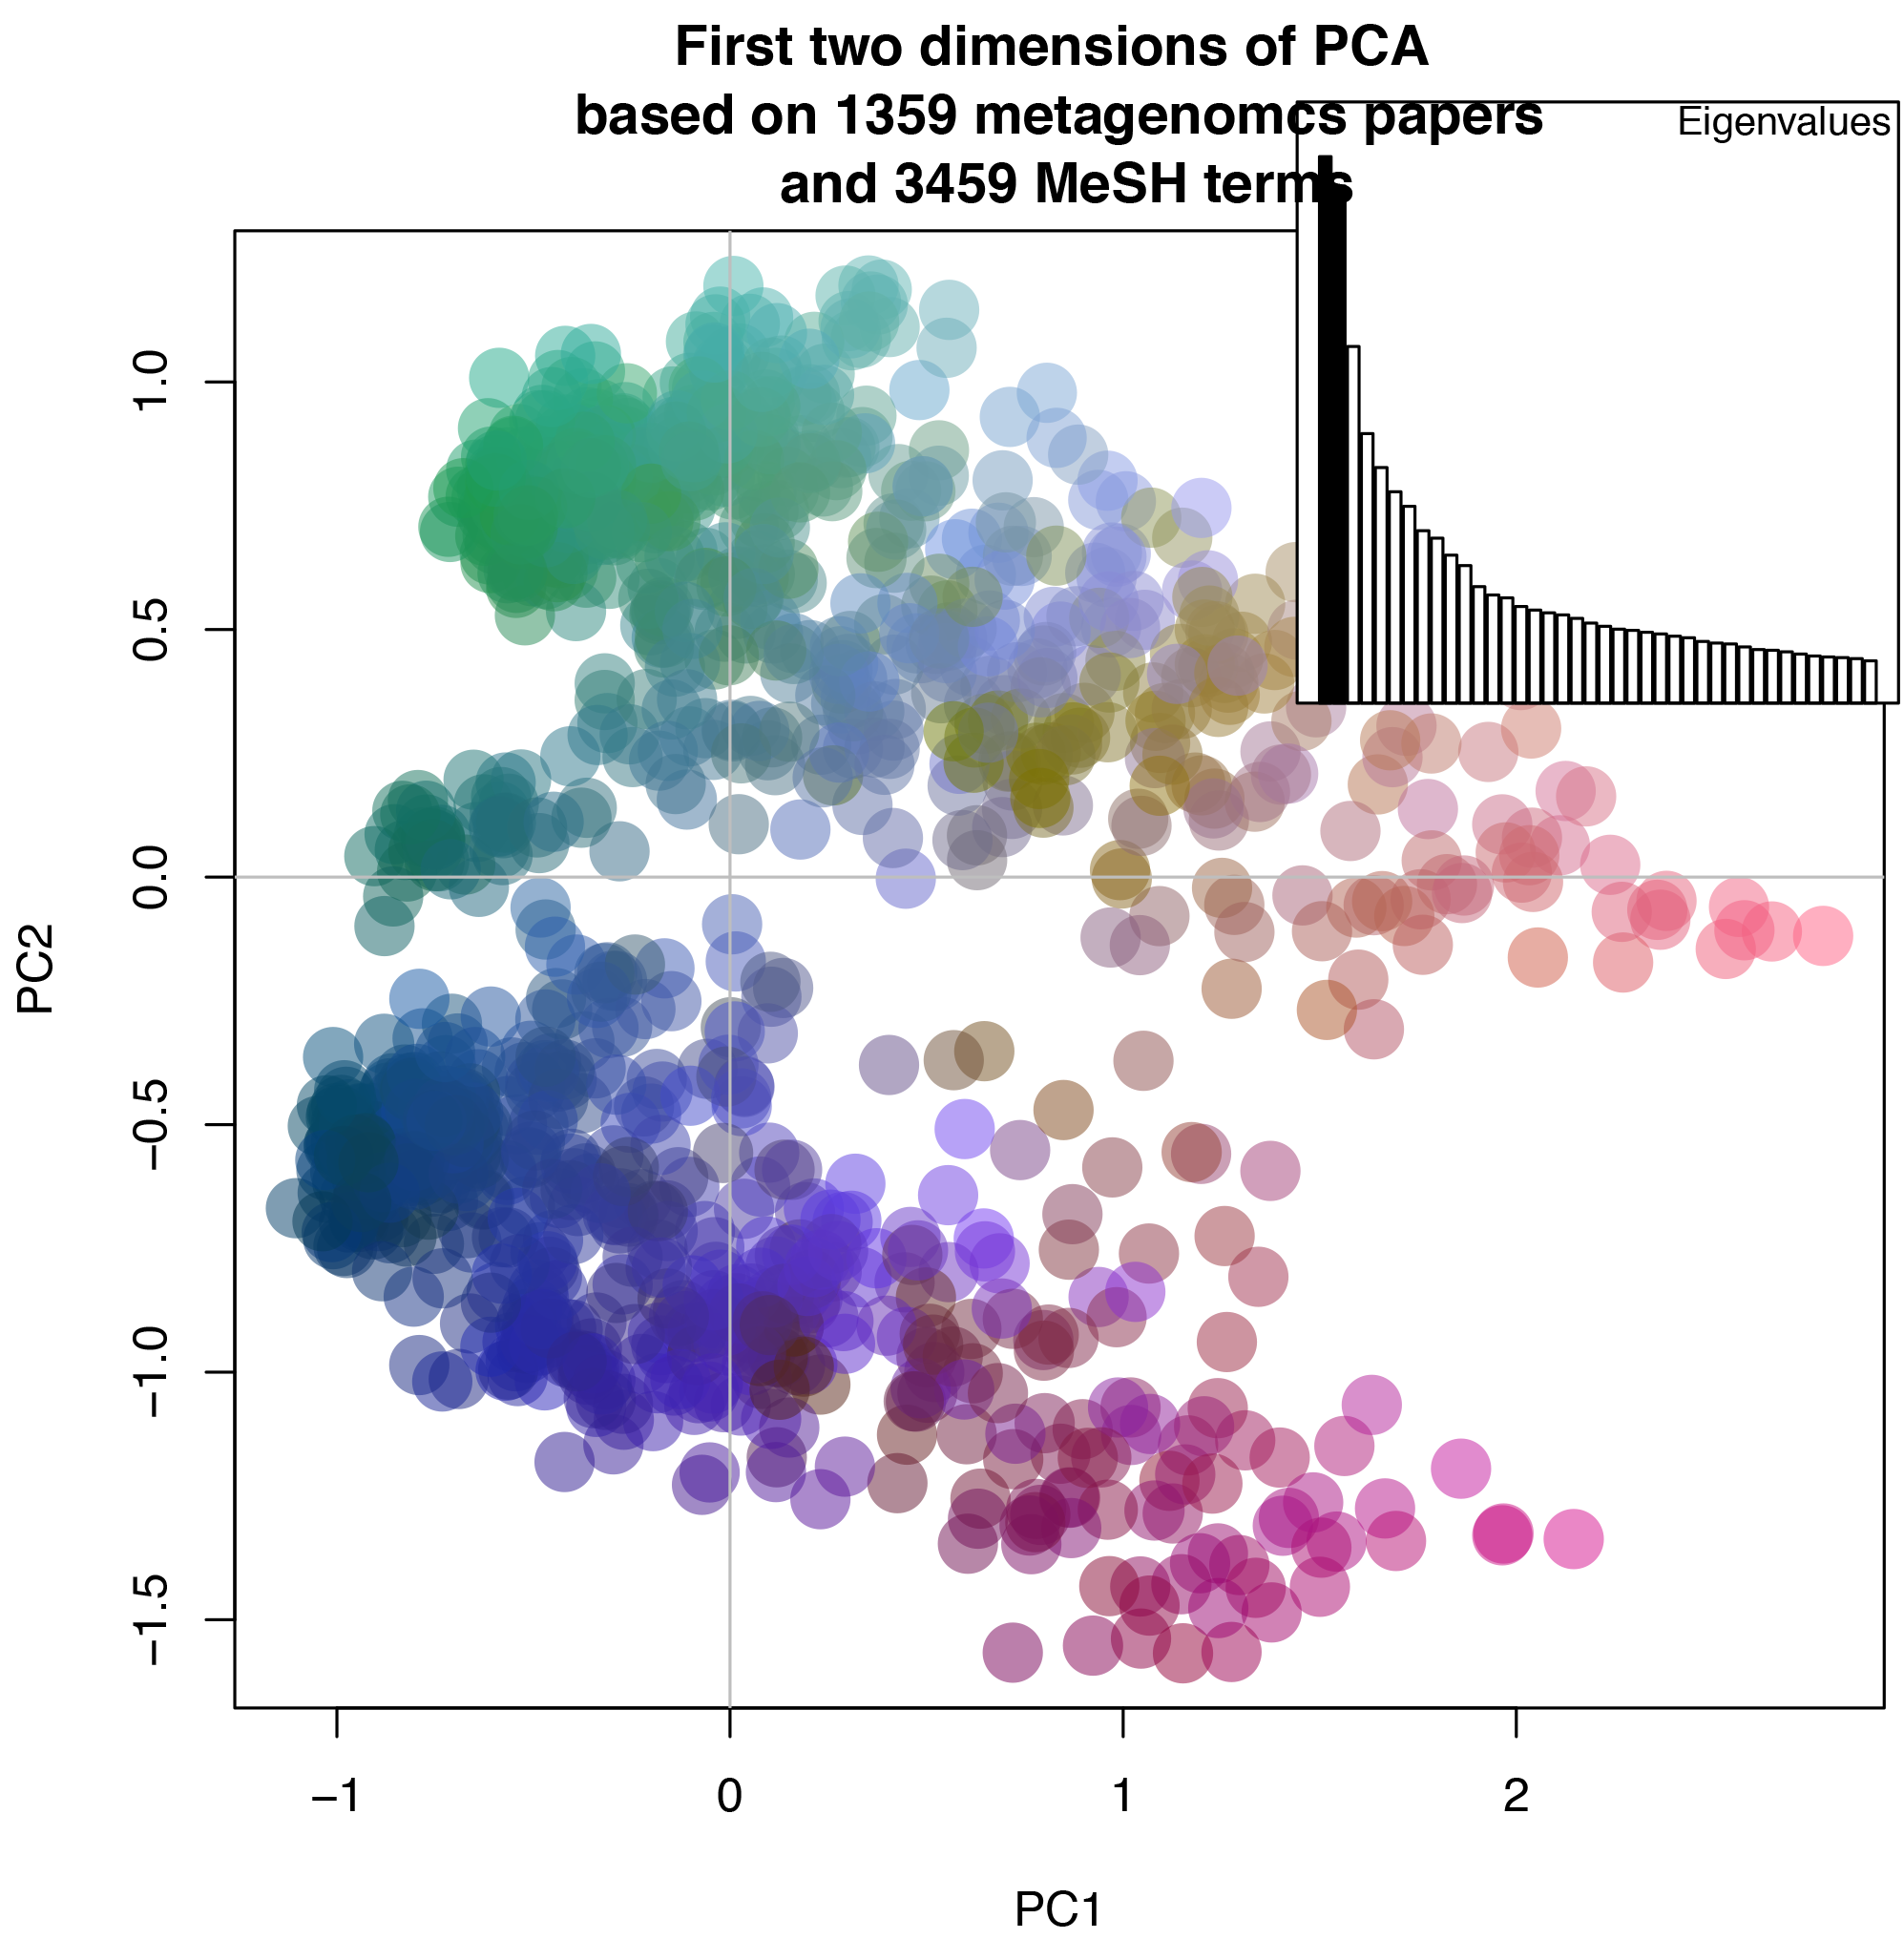
First two dimensions of PCA based on 1359 metagenomcs papers and 3459 MeSH terms

#R code
library(adegenet)
#Load SNPs
myPath <- "pubmed_result_metagenomics_ALL_parsed.fasta"#core SNPs retrieved with kSNP from 188 H. parasuis strains, removing from the analysis the strains tagged with ‘NK’ phenotype. kSNP k-mer sizes tested were 25, 20 and 15, selecting the run that gave more SNPs, i.e., 15.
core_SNPs_matrix <- fasta2genlight(myPath, chunk=1000, multicore=FALSE)#
core_SNPs_matrix <- as.matrix(core_SNPs_matrix)

# Principal Component Analysis (PCA)
pca1 <- glPca(core_SNPs_matrix) # 10 components saved
pca1

# Draw PCA colorplot
myCol <- colorplot(pca1$scores,pca1$scores, transp=TRUE, cex=4)
abline(h=0,v=0, col="grey")
add.scatter.eig(pca1$eig[1:40],2,1,2, posi="topright", inset=.05, ratio=.3)
title("First two dimensions of PCA \n based on 1359 metagenomcs papers \n and 3459 MeSH terms")
dev.copy2pdf(file = "Figure_12.pdf") #Save as .pdf#
$\endgroup$
2
  • 3
    $\begingroup$ The nice scatterplot clearly reveals that it is the second pc that discriminates the two clusters. $\endgroup$
    – Michael M
    Commented Jul 17, 2014 at 16:48
  • 1
    $\begingroup$ @Michael That's a good point. A closer look suggests a nontrivial linear combination of the PCs is needed--something around PC2 + 0.4 times PC1. Looking at it this way reveals the potential importance of the "sub-cluster" around PC1 < 0, PC2 = 0, because this linear discriminator appears to be ambiguous only at such points. It might be a good idea to see whether an additional principal component could discriminate that subcluster. (Or one could just start over and apply an SVM...) $\endgroup$
    – whuber
    Commented Feb 11, 2015 at 18:10

1 Answer 1

9
$\begingroup$

The "most important" principal component is usually considered to be the one with the largest eigenvalue. If your package works in the usual way this should be the first principal component, PC1. To see how important each component is, divide the eigenvalues by the number of variables you are decomposing. This tells you the percent of the variation in the data "explained" by each component. How many components you use is ultimately up to you, though you may want to look at this paper.

EDIT To find the most important variables in terms of their contributions to the principal component, you will indeed have to look at loadings. Loadings are the projections of the principal components onto your variables. A particularly high (or particularly low) loading for a specific variable means that principal component is intimately related to the variable. My experience with PCA is mostly from stock returns, where we think of high loadings as representing some exposure for a company from an underlying risk. In this setting, high loadings mean lots of exposure. Here you could think of them as some common subject matter across papers, and the loading is how much that paper fits into that subject (or depending on how your data is organized how much the keyword fits into that subject).

So it absolutely makes sense to look at those variables which contribute most to your principal component, and to find them in terms of the absolute value of their loadings - as the meaning of a principle component is ultimately unclear.

$\endgroup$
5
  • $\begingroup$ Thanks for you response j-kahn. What I mean is that I'm looking for the original variables that are more important to discriminate papers in PC1. $\endgroup$
    – biotech
    Commented Jul 17, 2014 at 9:29
  • $\begingroup$ Is it OK to look at the loadings in PC1 for all the variables and get the variables with values further from zero? Also, I don't well know how to interpret loadings. $\endgroup$
    – biotech
    Commented Jul 17, 2014 at 9:34
  • $\begingroup$ I've edited the response to reflect this. $\endgroup$
    – jayk
    Commented Jul 17, 2014 at 15:21
  • $\begingroup$ It's more clear now, thanks! Last question: Do papers having variables with high (and positive) loadings have then lower PCA1 scores? (and viceversa for papers not having them) $\endgroup$
    – biotech
    Commented Jul 17, 2014 at 16:18
  • $\begingroup$ In your case, loadings might show how much a certain keyword indicates a paper fits into a latent category. Scores would then show how much the paper fits into that category. Papers having (high values of) variables with high loadings for PCA1 should have higher PCA1 scores as the score of a paper is just the vector product of the loadings and that paper's variables. $\endgroup$
    – jayk
    Commented Jul 18, 2014 at 15:53

Your Answer

By clicking “Post Your Answer”, you agree to our terms of service and acknowledge you have read our privacy policy.

Not the answer you're looking for? Browse other questions tagged or ask your own question.