4
$\begingroup$

I am trying to get my regression right. I want to see, if subs increase how much increase in revenue is seen. The dependent variable is Revenue while the independent variable is subscribers.

Least squares method regression shows the following equation 24.4x - 189,883,443. I can't make sense of it. If subs increase means increase in revenue, then why this?

There is no 0 value and the lowest value for subscribers starts with 10 m while revenue starts with 180 m

How can i make sense of y = 24.4x - 189,883,443. Why is the intercept negative. Does it mean that one sub increase would mean a revenue increase of 24.4?

$\endgroup$
11
  • 1
    $\begingroup$ Is the intercept also significant? $\endgroup$
    – Andy
    Commented Sep 30, 2014 at 20:58
  • $\begingroup$ i don't have any negative value. Rather all values are pretty high. Also because it is a companies number. at 0 it wont be negative, revenue figures cant be negative. $\endgroup$ Commented Sep 30, 2014 at 21:00
  • $\begingroup$ the p value is 0.00000000000000000138574 $\endgroup$ Commented Sep 30, 2014 at 21:03
  • $\begingroup$ so it should be significant $\endgroup$ Commented Sep 30, 2014 at 21:03
  • 2
    $\begingroup$ That's estimated to be 24.4 more units of revenue per subscriber, as I already briefly outlined in comments on your earlier version of this question (and at the top in my answer here) ... but don't imagine that it's a causal relationship (i.e. that adding a 1000 subscribers will lead to about 24,400 more units of revenue; there are many reasons why using relations fitted to observational data to drive policy can go wildly astray when you assume they work like that -- not least, missing variables mean effects like Simpson's paradox can even flip the direction of a relationship.) $\endgroup$
    – Glen_b
    Commented Oct 1, 2014 at 23:59

6 Answers 6

12
$\begingroup$

Why is the intercept negative. Does it mean that one sub increase would mean a revenue increase of 24.4

The negative intercept does not mean "that one sub increase would mean a revenue increase of 24.4". The slope coefficient means something like that (but different to it). The negative intercept tells you where the linear model predicts revenue (y) would be when subs (x) is 0.

Your question appears to be prompted by confusion about the fact that in your fitted model, $E(Y|x=0)\neq 0$, even though logically, you would expect no revenue then.

This situation is not only common, it's to be expected. You normally cannot expect a relationship identified on data over a limited range to be appropriate everywhere, and so you should beware putting any real meaning on the fitted value at 0 unless your $x$ values encompass 0 (at which point you'll likely see that in fact revenue is much closer to what you'd expect there).

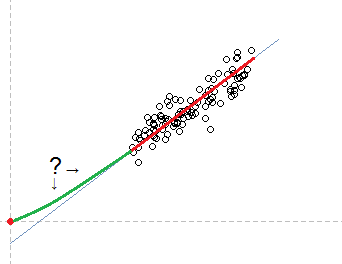
The assumption of linearity of relationship between $y$ and $x$ might be reasonable over the range of your x values, but that gives no basis on which to extrapolate outside the range of your data.

enter image description here
We don't really know what's going on in the green part.

Nevertheless you should check that assumption of linearity within the range of your data, via a residual plot.

[Even when you have good reason to fit a linear model to data that extends over the entire range of possible values of $x$ - including 0 - and to expect that $E(Y|x=0)= 0$ it's still pretty common practice to fit an intercept.]

$\endgroup$
6
  • $\begingroup$ Residual plot shows a random pattern, showing a good fit for linearity. Also, the green part shows that it will go to the negative side. But that should not happen, How should i read the equation then :( $\endgroup$ Commented Oct 1, 2014 at 5:38
  • 4
    $\begingroup$ It sounds like you completely misunderstand what the green curve is intended to convey. $\endgroup$
    – Glen_b
    Commented Oct 1, 2014 at 12:12
  • 1
    $\begingroup$ +1 The plot is helpful. Based on comments by the OP I suspect that the use of "revenue" here may be unconventional; it seems to refer to some form of net revenue. That interpretation resolves the apparent problem of projecting nonzero "revenue" for zero subscribers. $\endgroup$
    – whuber
    Commented Oct 1, 2014 at 15:09
  • $\begingroup$ Yes apparently, no one has ever or could ever see 0 subscribers. While the plot is somehow trying to predict revenue at 0. Is there anyway of going around this problem ? Also, how can revenue ever be in negative when the number utilized is gross revenue. $\endgroup$ Commented Oct 1, 2014 at 20:20
  • 4
    $\begingroup$ Well, no, the plot isn't trying to predict anything, it's simply showing that a relationship can be essentially linear where the data is and yet not actually have expectation where the extrapolation to zero would suggest. When you find the negative intercept of the line confusing, that's because you are placing an interpretation on the fitted equation as having a prediction at subs=0. I'm trying to convey why such an intepretation should not be taken remotely seriously as a prediction. You shouldn't project such equations beyond the range of the data ... (ctd) $\endgroup$
    – Glen_b
    Commented Oct 1, 2014 at 23:41
1
$\begingroup$

The negative intercept means that, if subscribers were 0, the predicted revenue would be -189,883,443 and that predicted revenue increases by 24.4 for each subscriber.

This is a nonsensical result, so, it is probable that either 1) You did something wrong in Excel and aren't doing what you think you are doing (very easy to believe, Excel is not great for statistics

2) There are violations of the assumptions. Possibly outliers or leverage points.

3) The form of the relationship is not linear.

(There could be other reasons too).

$\endgroup$
8
  • $\begingroup$ The graph shows positive linear relation ship. Also at some 100th percentile you do see 2 outliers. Other than that it is simple subscriber base and revenue from that base. Yes the lowest value is not very far away from mean. So the best fit line made if extended may cross through the negative side at 0. $\endgroup$ Commented Sep 30, 2014 at 21:10
  • $\begingroup$ Also, i have checked the data again and again. It is completely fine and taking out the outliers wont help either. Which software would you recommend. Which is easy and requires not much of the programming background :) $\endgroup$ Commented Sep 30, 2014 at 21:12
  • $\begingroup$ I don't know any software that meets both those requirements, but doing a linear regression is pretty easy in any software - R, SAS, SPSS.... Whatever you have. R is free, which is nice. If the lowest value is not far from the mean, then that variable is very skew. Taking log of revenue might be good. Hard to tell without seeing the scatterplot $\endgroup$
    – Peter Flom
    Commented Sep 30, 2014 at 21:18
  • 3
    $\begingroup$ It seems to me that some consideration of units of measurement ought to enter into pronouncements of nonsensicality, which is a severe judgment. For instance, if subscribers are measured in the millions and revenue only in dollars, then this intercept could be practically zero. Another possibility is that "revenue" is being used to mean "profit" or "net cash flow" or something of the sort. Either of these would be a more benign construction to put on the output than any of the possibilities suggested in this answer (although I suspect all three of the answer's possibilities could be true). $\endgroup$
    – whuber
    Commented Sep 30, 2014 at 21:45
  • 1
    $\begingroup$ Good point @whuber I assumed the units were sensible, but often they are not. I was thinking dollars (units) and subscribers (units) but (as I know from clients!) people do weird things sometimes. $\endgroup$
    – Peter Flom
    Commented Sep 30, 2014 at 22:59
0
$\begingroup$

In a regression model, an attempt is made to explain y (dependent variable) with the help of known independent variables.The simple one independent variable regression could be written as y = a + bx. It is quite possible that x alone cannot explain all the variations in y ie., there may be some error in the predictions of y by the selected model. The Intercept represents the average error that we are going to commit if we predict all the possible y values with the help of x values. The second interpretation is when X=0 what value y could take. So, mathematically, the intercept is the y value when x is made equal to zero. The third explanation could be that it is the unexplained variation in y due to X. It is expected that if a model is perfect, the unexplained variation in y should be 0 and thereby the intercept should be zero. In a regression model where the intercept is negative implies that the model is overestimating on an average the y values thereby a negative correction in the predicted values is needed.

$\endgroup$
0
$\begingroup$

Your lowest data value is 10m fand you are wanting to extrapolate the model down to 1, with the assumption that it remains linear across that range. Perhaps if you plot the line, and it's 95% prediction interval, you'll see a very wide range of possible values where the intercept could be at the low end, which could include positive and negative values for the intercept, including 0. I try and look at the prediction interval for a simple linear regression to get a sense of what extrapolation might be valid. Graphpad Prism does this nicely for you, although you could take advantage of free programs like R and quickly and easily follow any of the multiple online step-by-step guides that could plot it for you.

$\endgroup$
0
$\begingroup$

If you're using Excel and your X-axis are dates, and your linear regression equation looks like y = 0.04x - 1900 (slope = 0.04), that is because Excel converts dates into days since Jan. 1, 1900 (some large numbers), so your intercept is huge. I had this situation, but when I instead used period (counting from 1) for the X axis, my linear equation was: y = 1.3x + 13 (slope = 1.3). It made a LOT more sense!

$\endgroup$
0
$\begingroup$

Although this is an old post, I came across it and have an interpretation of the results to share. The expected revenue given that the number of subscribers is zero implies that the business is paying money rather than receiving it. Consider that at the core of this data exist some fundamental economics. Theoretically, negative revenue suggests a business could be issuing returns beyond their receivables, or they could be paying a subscriber (that doesn’t actually exist because the OP is discussing the intercept, which we are interpreting when the number of subscribers equals zero).

Corporations have reported negative revenues in the past, most notably after the global crisis in 2020. The mathematics here make sense because of the economics and accounting. Sometimes these results are attributable to accounting practices, but recall that the data from which we are making our inferences is derived from those same accounting methods. The coefficients and intercept of the OP’s model are a direct result of those inputs.

Each scenario in one’s data exploration and analyses will come with its own unique set of considerations. It’s normal to question our results and I encourage it. For anyone who lands on this page sometime in the future, I hope you find these comments helpful to think about.


Edit: In response to the comments about mixing revenues and profits, beware that these concepts have different meanings and my post may have not made that clear. In fact, the word revenue is perhaps the most misleading on a balance sheet because the numbers strictly depend on how a business decides to structure its books.

Depending on the type of firm, companies may be reporting net revenue, which is the value after returns, discounts, cost of goods sold (COGS), etcetera. Net revenue is also not profit because it does not deduct all expenses, rather only revenue expenses. By strict definitions, if a business has no sales or goods/services being rendered as a result of having no customers we might say revenues should equal zero. However, revenue can come from activities not related to the original business, such as leasing a building or machinery, known as “other revenue”.

The reality is that accounting practices allow for counterintuitive manipulations of the numbers. If working with real-world data, thinking about such nuances can assist in identifying the sources of discrepancies to clarify our otherwise unintuitive results. For corporate projects, someone in the organisation should be able to answer questions or provide insights about your findings, so by all means ask questions and seek input from the source.

$\endgroup$
2
  • $\begingroup$ I think this mixes up revenue and profit, but the point that we need to understand the data better is a good one. $\endgroup$
    – mkt
    Commented Aug 5, 2023 at 5:54
  • $\begingroup$ @mkt Good point. Thanks for mentioning. $\endgroup$ Commented Aug 5, 2023 at 17:45

Your Answer

By clicking “Post Your Answer”, you agree to our terms of service and acknowledge you have read our privacy policy.

Not the answer you're looking for? Browse other questions tagged or ask your own question.