14
$\begingroup$

I have two datasets:

My first dataset is the value of an investment (in billions of dollars) against time, each unit time being one quarter since Q1 of 1947. The time extends to Q3 of 2002.

My second dataset is "the result of transforming the values of the investment in [the first dataset] to an approximately stationary process".

First set of data and Second set of data

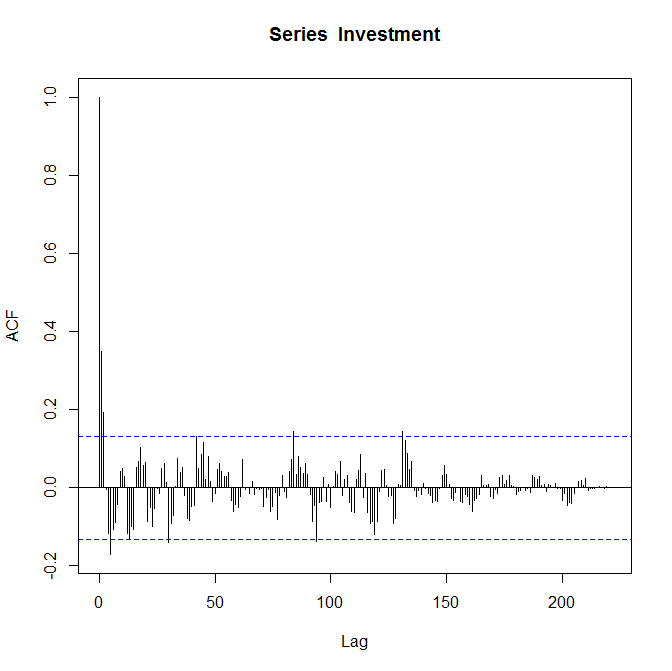
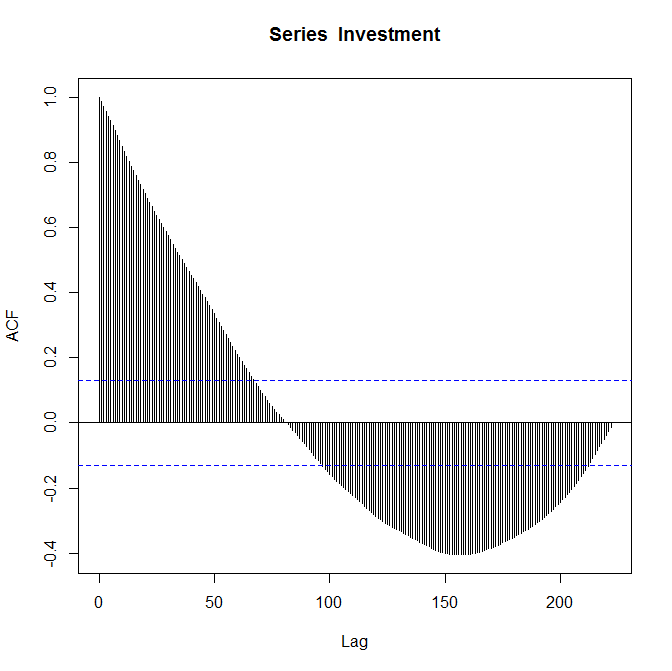
Respective ACF plots:

First set of data, ACF

Second set of data, ACF

I know that the plots are correct and I am asked to "comment on them". I am relatively new to the autocorrelation function and I'm not entirely sure what it tells me about my data.

If anyone could take the time to briefly explain it would be VERY much appreciated.

$\endgroup$
4
  • 2
    $\begingroup$ When you say "I am asked to comment on them" -- is this for some class? Also, you may find some of the results on this search helpful. Finally, the first link under "Related" in the sidebar to the right may be of some assistance. $\endgroup$
    – Glen_b
    Commented Dec 12, 2014 at 21:37
  • 2
    $\begingroup$ You can discuss and compare the persistence of the data in each series and whether this persistence creates a trend. You can also comment whether the ACF suggests some transformation to the data to render it stationary before choosing and fitting an ARMA time series model. $\endgroup$
    – javlacalle
    Commented Dec 12, 2014 at 22:02
  • $\begingroup$ Glen_b - Yep, this is an exercise. Trying to get my head around some of the core features of the module. I did take a very good look through the related questions and didn't quite get it. I'm familiar with this data and I feel like a short example answer would help me greatly. Javlacalle - Thank you for the reply. There is another part to the exercise in which you are required to suggest a relevant ARMA model. I understand that part I think... comparing the ACF to the PACF and looking at whether they cut off or tail off. A little confused about your 'persistence of data'. :( $\endgroup$
    – Ben Gerry
    Commented Dec 13, 2014 at 0:17
  • 3
    $\begingroup$ By persistence I meant how much the observation at time $t$ is influenced by the previous observations. High persistence usually creates a trend pattern in the series and is related to autocorrelations that decay (or go to zero) slowly; it can also be thought as the memory of the series to past shocks (e.g, in a random-walk the effect remains for ever since it is precisely an accumulation of shocks over time). Time series characterised by slowly decaying ACF will usually exhibit a smooth pattern and can be classified as long-memory time series. $\endgroup$
    – javlacalle
    Commented Dec 13, 2014 at 12:24

1 Answer 1

7
$\begingroup$

If your primary concern is to use the ACF and PACF plots to guide a good ARMA fit then http://people.duke.edu/~rnau/411arim3.htm is a good resource. In general, AR orders will tend to present themselves by a sharp cutoff in the PACF plot and a slow trending or sinusoidal degradation in the ACF plot. The opposite is usually true for MA orders...the link provided above discusses this in more detail.

The ACF plot you provided may suggest an MA(2). I would guess that you have some significant AR orders just looking at the sinusoidal decay in auto-correlation. But all this is extremely speculative since the coefficients become insignificant very quickly as lag increases. Seeing the PACF would be very helpful.

Another important thing you want to watch for is significance in the 4th lag on the PACF. Since you have quarterly data, significance in the 4th lag is a sign of seasonality. For example if your investment is a gift store, returns may higher during the holidays (Q4) and lower during the beginning of the year (Q1), causing correlation between identical quarters.

The significant coefficients for smaller lags in the ACF plot should stay the same as your data size increases assuming nothing changes with the investment. Higher lags are estimated with less data points then are lower lags (i.e every lag looses a data point), so you can use the sample size in the estimation of each lag to guide your judgment as to which will stay the same and which are less reliable.

Using the ACF plot to make deeper insights about your data (beyond just an ARMA fit) would require a deeper understanding of what type of investment this is. I have commented on this already.

For deeper insight... With financial assets, practitioners often log then difference price to obtain stationary. The log difference is analogous to a continually compacted returns (i.e. growth) so it has a very nice interpretation and there is a lot of financial literature available on studying/modeling series of asset returns. I assume your stationary data was obtained in this manner.

In the most general sense, I would say the auto-correlation means that returns on the investment are somewhat predictable. You could use an ARMA fit to forecast future returns or comment on the investment's performance when compared to a benchmark such as the S&P 500.

Looking at the variance in residual terms of the fit also gives you a measure of risk in the investment. This is extremely important. In finance you want an optimal risk to return trade off and you can decide if this investment is worth the money by comparing to other market benchmarks. For example, if these returns have a low mean and are hard to predict (i.e risky) when compared to other investment options, you would know its a bad investment. Some good places to start are
http://en.wikipedia.org/wiki/Efficient_frontier and http://en.wikipedia.org/wiki/Modern_portfolio_theory.

Hopefully that helps!
$\endgroup$
6
  • 1
    $\begingroup$ ALSO...it would be important to know how value is measured (market value?, book value?, appraised value?, etc). Is the investment a tradable asset such as a stock portfolio? is it tangible? Is it privately owned? Is the value of the investment adjusted for inflation? These type of questions help ascertain what the theoretic cause of auto-correlation may be, and what you can infer from it. $\endgroup$ Commented Dec 13, 2014 at 5:14
  • $\begingroup$ All very interesting, thank you for putting so much time into your reply. I'll definitely be looking into that! I think my question is much much simpler than the extra methods you've given, though. My question is simply: What am I looking for in an ACF plot? I mean, what does the first plot tell me? Do I look for patterns? The ACF seems to alternate, can I expect that to continue as more data is recorded? Or is the answer simply that there's not a lot to say? From a statistical standpoint, do these ACF plots actually tell you anything about the data or are they used only to find an ARMA model? $\endgroup$
    – Ben Gerry
    Commented Dec 13, 2014 at 12:23
  • $\begingroup$ It seems that ACF and PACF plots are found purely to find relevant ARMA models, does the ACF plot by itself say anything at all? $\endgroup$
    – Ben Gerry
    Commented Dec 13, 2014 at 12:35
  • 1
    $\begingroup$ I have considered your comments. See edits $\endgroup$ Commented Dec 13, 2014 at 21:07
  • $\begingroup$ Thank you for being so helpful, Zachary. The PACF plot is here if you would like to see it: i.imgur.com/z79XTUZ.png Would you agree that this, compared with the ACF, suggests that the dataset could be best fit to an AR(3) model? If its the PACF I should be inspecting then I suppose it would be AR(1)? $\endgroup$
    – Ben Gerry
    Commented Dec 14, 2014 at 17:52

Your Answer

By clicking “Post Your Answer”, you agree to our terms of service and acknowledge you have read our privacy policy.

Not the answer you're looking for? Browse other questions tagged or ask your own question.