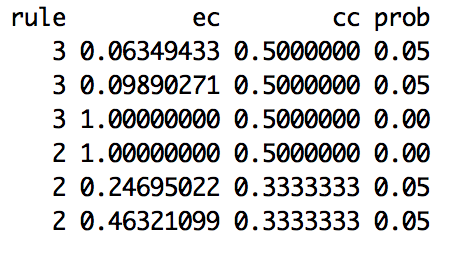
I have this data generated from simulations. For each "prob" I observe the mean value of cases with "rule" = 1,2,3 or 4. So in the example below, for "prob=.05" all cases with "rule=2" have a mean value of "cc=.333..".

I cannot store each case since it would output a gigant dataset, and that is why I keep the mean values (among other summary statistics like the max values, min values standard deviation, number of cases, etc).
I am looking for a statistical test that tells me if the observed mean values are different for each rule, and that can deal with the fact that:
- these are non-normally distributed
- there are different number of cases per rule (30% are rule 1, 20% are rule 2, 10% are rule 3, etc)
- these are actually mean values.
- each rule has different standard deviations and standard errors
Any ideas?
Thank You in advance.
Addendum: I have different network topologies generated by the parameter "prob". At the end of each run, nodes end up being of one "rule". I would like to statistically know if node measures as the clustering coefficient (here "cc") or the eigenvector centrality measures (here "ec") are different for each rule as "prob" changes. When "prob=0" each node has the same values of "cc" and "ec", since the network is regular with same degree for each node. Indeed the node measures have a finite range since they are constrained by the network topology.
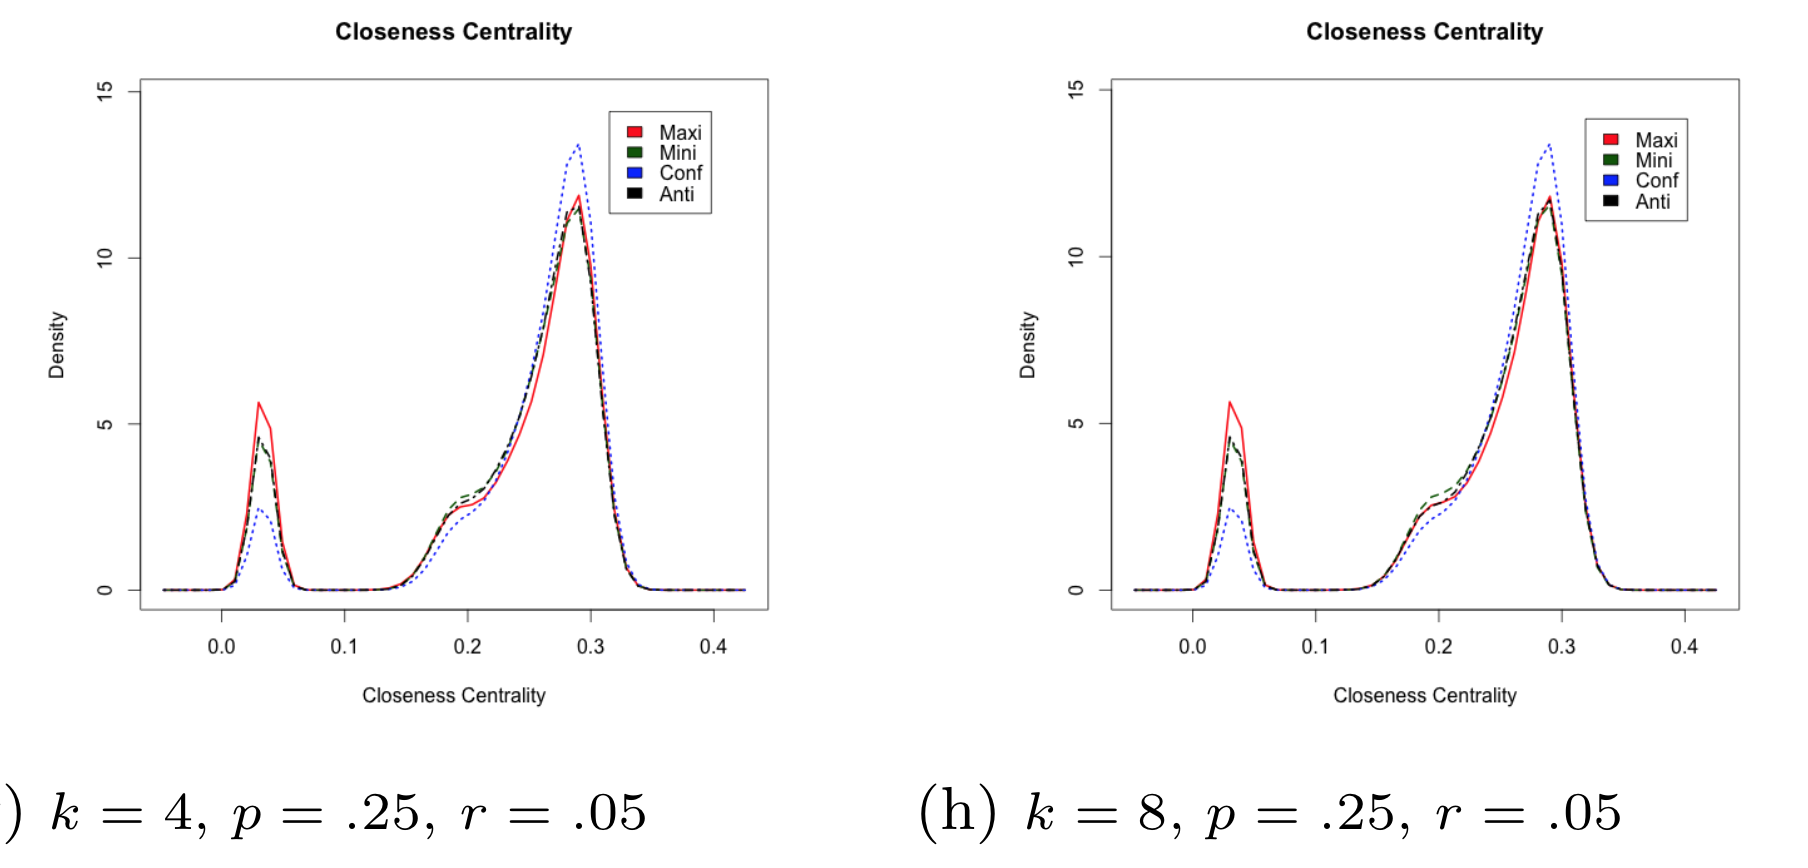
I do not think I can assume normality, if I look at the density plots of interest.

