6
$\begingroup$

I am looking for a few rules of thumb of when to determine that my data is 'normal enough' to use a t-test vs. a Mann-Whitney U-test.

From what I have read, most real world data sets are non-normal, and when sample sizes are large, tests including the Shaprio-Wilk will always reject the null hypothesis. I also know that you can look at the Q-Q plot to determine normality, although this seems to be more of a guesstimate than a hard and fast normal vs. non-normal.

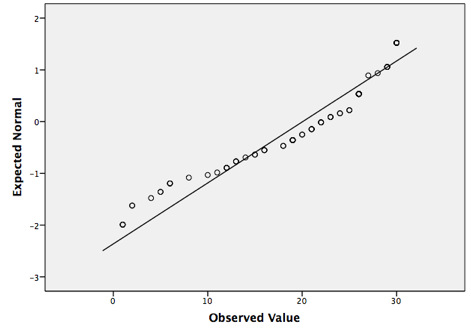
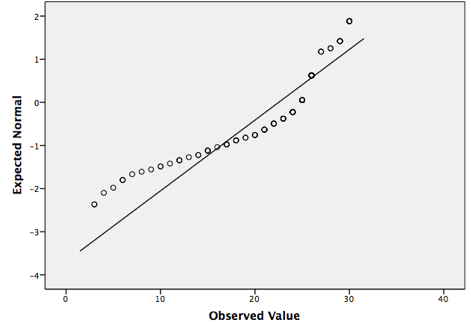
Just a few examples to comment on - would you say Q-Q 1 is normal? What about Q-Q 2?
QQ 1

QQ 2

$\endgroup$
7
  • 1
    $\begingroup$ Closely related: How to choose between t-test or non-parametric test e.g. Wilcoxon in small samples? $\endgroup$ Commented May 10, 2015 at 16:32
  • $\begingroup$ Do you know how the reference lines were drawn in your software? Usually the line goes through the 25th & 75th percentile, but that doesn't seem to be the case here. $\endgroup$ Commented May 10, 2015 at 16:34
  • $\begingroup$ Thank you for the link above - very good read. I'm using SPSS, but I am not 100% sure how the software is choosing the line. $\endgroup$ Commented May 10, 2015 at 16:48
  • $\begingroup$ The idea that you can have "a hard and fast normal vs non-normal" is illusory. If you aren't in a position to say (e.g. from some a priori knowledge of the distribution shape, the sample size or both) "the t-test should be fine", you should not assume it. Deciding which test to do on the basis of the sample leaves neither test having its nominal properties, and the resulting overall properties are often substantially less useful than simply doing Mann-Whitney; if you have reason (a priori) to think that the tails are not too heavy & distribution not very skew, the t-test should be fine $\endgroup$
    – Glen_b
    Commented May 11, 2015 at 1:59
  • $\begingroup$ If those plots are typical of your distribution shapes, it will matter little which test you choose. You have mild skewness, it won't harm the properties of the t very much (though I'd lean toward MW or a permutation test of means myself). If you use a $t$, make sure you allow for unequal variance (that is, do Welch or something along those lines --- and don't test for equal variances, just assume they're different). $\endgroup$
    – Glen_b
    Commented May 11, 2015 at 2:07

1 Answer 1

8
$\begingroup$

In general, the $t$-test is very robust. Three assumptions are typically listed: independence, homoscedasticity, and normality. The assumption that the residuals are normally distributed comes last and is least important. If those two qq-plots are for the two groups that you want to compare, you probably have enough data and the data are normal enough, that you can use the $t$-test without fear.

Bear in mind that if the data are not truly normal, the Mann-Whitney $U$-test can be more powerful while maintaining your preferred type I error rate. The $t$-test, on the other hand, would be less powerful and if not perfectly normal the type I error rate will diverge slightly from the specified level (just not enough to fuss over). In that sense, if you are concerned it may be better to just use the Mann-Whitney as is explained in the linked thread.

$\endgroup$
0

Your Answer

By clicking “Post Your Answer”, you agree to our terms of service and acknowledge you have read our privacy policy.

Not the answer you're looking for? Browse other questions tagged or ask your own question.