5
$\begingroup$

Thousands of randomized trials are ongoing or in the planning. These trials rely on randomization procedures (e.g. patients being randomized to either placebo or active drugs) to yield two balanced groups, who do not differ significantly for any imaginable variable.

But what are the chances that such a randomization yields unbalanced groups?

Is there a chance that randomness is not random?

What could the causes be? Is it a technical/software issue or is it mere probability?

$\endgroup$
2
  • 1
    $\begingroup$ There are ways to guarantee balance (or any desired degree of imbalance) while performing random allocation. You can, for example, do the equivalent of having $w$ white balls and $b$ black balls randomly drawn without replacement. This generalizes to multiple different treatment groups (more colors of balls) $\endgroup$
    – Glen_b
    Commented May 11, 2015 at 0:24
  • 2
    $\begingroup$ The purpose of randomization is not to guarantee unambiguous results. It is to help establish the validity of the statistical model being used to do the analysis. $\endgroup$
    – Russ Lenth
    Commented May 12, 2015 at 2:09

2 Answers 2

6
$\begingroup$

In the following answer, I'm going to discuss imbalances between the number of subjects allocated to the groups. If you're instead interested in imbalances in covariates, see myth 5 in Senn (2013).

The following is adapted from section 3.2 in Rosenberger & Lachin (2016). If you have two groups and subjects are assigned to the two groups by a fair coin toss, you have complete randomization. To see why complete randomization is sometimes unattractive, let $N_A(i)$ be the number of patients randomized to treatment $A$ after $i$ patients have been randomized. In the same manner, let $N_B(i) = i-N_A(i)$ be the number of patients randomized to treatment $B$. By the central limit theorem, $N_A(i)$ is asymptotically normal with mean $n/2$ and variance $n/4$. Letting $D_n=N_A(n) - N_B(n) = 2N_A(n)-n$, we see that $D_n$ is asymptotically normal with mean $0$ and variance $n$. The measure $|D_n|$ can be used to describe the degree of imbalance between the groups. For $r>0$, $$ \operatorname{Pr}(|D_n|>r)\approx 2\left\{1 - \Phi(r/\sqrt{n})\right\} $$ where $\Phi$ is the standard normal CDF.

Here is a table of the percentiles of the distribution of $|D_n|$ for complete randomization:

n <- c(50, 100, 200, 400, 800) # Vector of sample sizes
p <- c(0.33, 0.25, 0.10, 0.05, 0.025) # Vector of probabilities
# Calculate percentiles
perccr <- round(
  outer(n, p, 
      \(n, p)(qnorm(p/2, mean = 0, sd = sqrt(n), lower.tail = FALSE))
), 1)

rownames(perccr) <- n
colnames(perccr) <- p
perccr

    0.33 0.25  0.1 0.05 0.025
50   6.9  8.1 11.6 13.9  15.8
100  9.7 11.5 16.4 19.6  22.4
200 13.8 16.3 23.3 27.7  31.7
400 19.5 23.0 32.9 39.2  44.8
800 27.6 32.5 46.5 55.4  63.4

For example: When $n=200$, there is a $5\%$ probability of an imbalance of $\pm 27.7$ or worse.

The important thing to note is that imbalance does not lead to unbiased effects per se but it will decrease the precision of the estimator. Hence, imbalance will negatively affect the statistical power of the trial. But how much?

Let's compare the power curves for a comparison of two normal means with equal variances assumed to be known and significance level $\alpha = 0.05$. Assume that the absolute mean difference between the groups is $0.5$ and $\sigma = 1$. Further, let $Q = n_A/n$ so that $Q$ indicates imbalance as it goes further away from $0.5$.
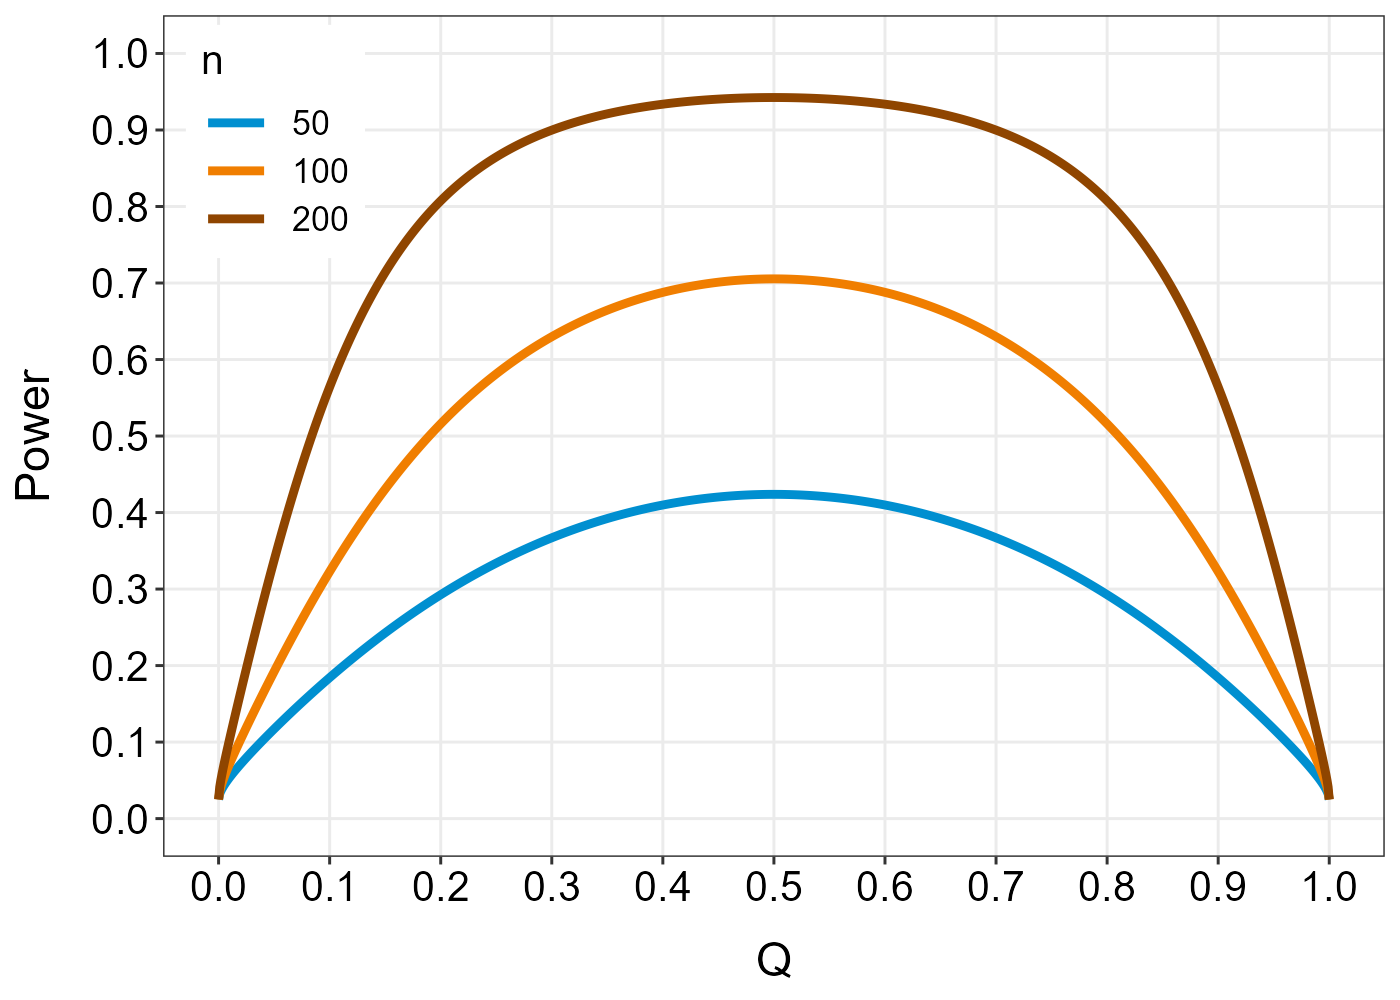
PowerCurve

For large $n$, there is little loss of power for $Q$ between $0.3$ and $0.7$. The table we calculated above indicates that such a large imbalance is unlikely. However, there exist a number of restricted randomization procedures which try to protect against imbalances while also protecting against biases.

References

Rosenberger WF, Lachin JM (2016): Randomization in clinical trials: theory and practice. 2nd ed. John Wiley & Sons.

Senn, S. (2013). Seven myths of randomisation in clinical trials. Statistics in medicine, 32(9), 1439-1450. (link)

$\endgroup$
3
$\begingroup$

As for the chances, that is difficult to assess. But one always should run tests on the baseline and attest if the variables that might be related to the treatment hold any difference between treatment and control groups. If you need some correction, you might run a propensity score on your sample in order to match your sample adequately.

Below I will list some of the possibilities of the biases that you might run on randomized experiments.

By Heckman and Smith (1995), in experiments that are also randomized by locality, you might have groups of people who will anticipate the program and move to the region of treatment -- this is a bias that might be hard to overcome, I believe, if that is a possibility.

Also, control groups might change their behavior. Say, when there is a conditionality of schooling frequency to receive the treatment. If the control group knows it will receive the treatment benefit in the near future, the group might behave similarly to the treatment group in order to receive the treatment in the near future. Another bias might be related to other social programs that one of the groups (or both the control and the treatment group) might be receiving.

One more bias that is frequently studied today it is related to spillover effects from the treated to the control groups (the violation of the SUTVA hypothesis). If we are considering a money benefit inside a village in which both control and treatment groups engage, one should consider general equilibrium effects -- for instance, money lending by extended families (thus money going from treatment to control groups), an idea tested by Angelucci and Giorgi (2009).

Edit: As for the 'truly randomized procedure' you mean what exactly?

$\endgroup$

Your Answer

By clicking “Post Your Answer”, you agree to our terms of service and acknowledge you have read our privacy policy.

Not the answer you're looking for? Browse other questions tagged or ask your own question.