4
$\begingroup$

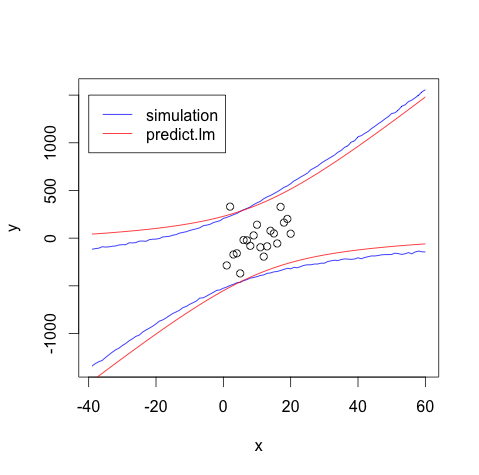
I was trying to simulate the prediction interval for lm model in R, but I found out that my prediction interval is consistently biased. I've attached the code, and a sample figure below. Any idea why?

n = 20     # number of points
N = 10000  # simulation rounds
x = 1:n    # x
s = 200    # standard deviation of error

set.seed(12)
e = rnorm(n, 0, s)

a = 5; b = 5  # slope, intercept

y = a * x + b + e

## lm model
mod1 = lm(y ~ x)
summ_mod1 = summary(mod1)

## std errors
coefs = summ_mod1$coefficients[, 1:2]
sigma = summ_mod1$sigma

## predict new data using simulation
new.x = (min(x) - 2 * max(x)):(max(x) + 2 * max(x))

upper = rep(0, length(new.x))
lower = rep(0, length(new.x))
tmp   = rep(0, N)

for (i in 1:length(new.x)) {
  tmp = rnorm(n = N, mean = coefs[1, 1], sd = coefs[1, 2]) +
        rnorm(n = N, mean = coefs[2, 1], sd = coefs[2, 2]) * new.x[i] +
        rnorm(n = N, mean = 0, sd = sigma)

  upper[i] = mean(tmp) + 1.96 * sd(tmp)
  lower[i] = mean(tmp) - 1.96 * sd(tmp)
}

plot(x, y, type = "p", 
     xlim = c(min(new.x), max(new.x)),
     ylim = c(min(lower), max(upper)))
lines(new.x, lower, col = "blue")
lines(new.x, upper, col = "blue")

## R's prediction interval
pred.int =  predict(object = mod1, 
                    newdata = data.frame(x = new.x), 
                    interval = "predict")

pred.lower = pred.int[,2]
pred.upper = pred.int[,3]

lines(new.x, pred.lower, col = "red")
lines(new.x, pred.upper, col = "red")

legend(x = -40, y = 1500, 
       legend = c("simulation", "predict.lm"),
       lty = c(1, 1),
       col = c("blue", "red"))

Prediction interval

$\endgroup$
4
  • $\begingroup$ Could you also describe your simulation extra to providing the code for it? $\endgroup$ Commented Dec 5, 2015 at 21:16
  • $\begingroup$ Your simulation is ignoring the covariance between the estimated parameters. $\endgroup$
    – atiretoo
    Commented Dec 5, 2015 at 21:52
  • $\begingroup$ Yes, that's very true! How do I incorporate that into my simulation? $\endgroup$
    – Alireza
    Commented Dec 5, 2015 at 22:01
  • $\begingroup$ Richard, I'm basically sampling both the estimated parameters (slope and intercept), and the errors (residuals), to get a distribution of response for every new data point, and draw the 95% confidence interval for each point. $\endgroup$
    – Alireza
    Commented Dec 5, 2015 at 22:27

1 Answer 1

5
$\begingroup$

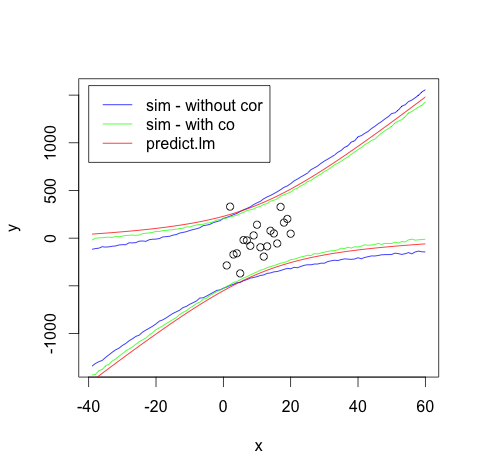
Thanks to atireto's comment, I realized that I haven't taken into account the covariances between the estimated parameters. I was assuming that a and b are uncorrelated random variables, but they are not. So I corrected the sampling of a and b by converting them to correlated random variables using Cholesky decomposition of variance-covariance matrix (see here).

Here's the corrected code:

rm(list = ls())

n = 20     # number of points
N = 10000  # simulation rounds
x = 1:n    # x
s = 200    # standard deviation of error

set.seed(12)
e = rnorm(n, 0, s)

a = 5; b = 5  # slope, intercept

y = a * x + b + e

## lm model
mod1 = lm(y ~ x)
summ_mod1 = summary(mod1)

## std errors
coefs = summ_mod1$coefficients[, 1:2]
sigma = summ_mod1$sigma

## predict new data using simulation
new.x = (min(x) - 2 * max(x)):(max(x) + 2 * max(x))

upper = rep(0, length(new.x))
lower = rep(0, length(new.x))
tmp   = rep(0, N)

for (i in 1:length(new.x)) {
  tmp = rnorm(n = N, mean = coefs[1, 1], sd = coefs[1, 2]) +
        rnorm(n = N, mean = coefs[2, 1], sd = coefs[2, 2]) * new.x[i] +
        rnorm(n = N, mean = 0, sd = sigma)

  upper[i] = mean(tmp) + 1.96 * sd(tmp)
  lower[i] = mean(tmp) - 1.96 * sd(tmp)
}

plot(x, y, type = "p", 
     xlim = c(min(new.x), max(new.x)),
     ylim = c(min(lower), max(upper)))
lines(new.x, lower, col = "blue")
lines(new.x, upper, col = "blue")

## R's prediction interval
pred.int =  predict(object = mod1, 
                    newdata = data.frame(x = new.x), 
                    interval = "predict",
                    level = 0.95)

pred.lower = pred.int[,2]
pred.upper = pred.int[,3]

lines(new.x, pred.lower, col = "red")
lines(new.x, pred.upper, col = "red")

## taking the variance-covariance matrix into account
L = chol(vcov(mod1))

for (i in 1:length(new.x)) {
  beta = matrix(c(rnorm(n = N),
                  rnorm(n = N)), 
                nrow = 2)

  beta_cor = t(L) %*% beta

  tmp = coefs[1, 1] + beta_cor[1, ] +
        (coefs[2, 1] + beta_cor[2, ]) * new.x[i] +
        rnorm(n = N, mean = 0, sd = sigma)

  upper[i] = mean(tmp) + 1.96 * sd(tmp)
  lower[i] = mean(tmp) - 1.96 * sd(tmp)
}

lines(new.x, lower, col = "green")
lines(new.x, upper, col = "green")

legend(x = -40, y = 1600, 
       legend = c("sim - without cor", "sim - with co", "predict.lm"),
       lty = c(1, 1, 1),
       col = c("blue", "green", "red"))

enter image description here

It still doesn't perfectly match the R's predict.lm result, but it's very close. In fact, if I change the 1.96 coefficient to something like 2.1, it matches it perfectly. Predict.lm is supposed to be 95% prediction interval, so I'm not sure this is happening.

$\endgroup$
4
  • $\begingroup$ As I decrease/increase the number of points, the gap between my simulation and predict.lm's result increases/decreases. I can't figure out exactly why though... What am I missing here? $\endgroup$
    – Alireza
    Commented Dec 6, 2015 at 0:00
  • 1
    $\begingroup$ The prediction interval from predict is using a t-value based on the sample size, which will approach 1.96 as it gets larger. Try replacing 1.96 in your simulation with qt(0.975,n) $\endgroup$
    – atiretoo
    Commented Dec 6, 2015 at 0:02
  • $\begingroup$ Thanks! It's much better now, but it still doesn't match it completely though, especially for smaller n, e.g. n = 5. $\endgroup$
    – Alireza
    Commented Dec 6, 2015 at 0:08
  • 3
    $\begingroup$ At that sample size you need is confidence limits on your confidence limits to be able to say if they are different or not! $\endgroup$
    – atiretoo
    Commented Dec 6, 2015 at 0:15

Your Answer

By clicking “Post Your Answer”, you agree to our terms of service and acknowledge you have read our privacy policy.

Not the answer you're looking for? Browse other questions tagged or ask your own question.