1
$\begingroup$

If I have 100 numbers from two separate groups $X$ and $Y$.

How can I manually estimate or derive an algorithm to automatically estimate $AVG(X)$ and $AVG(Y)$?

I know all the numbers, but I don't know which numbers belong to which group. Is it really possible to give a proper answer to this question?

$\endgroup$
4
  • $\begingroup$ It may be possible if you provide more information Eg if you specify the family of distributions from which the sample comes... You might want to look at expectation maximisation (EM) algorithm $\endgroup$
    – seanv507
    Commented Jan 25, 2016 at 7:06
  • $\begingroup$ I guess I can assume that follow a normal distribution. I have just read a bit about EM algorithm, but in the EM algorithm, it seems that I know which results belong to which group. $\endgroup$
    – Jamgreen
    Commented Jan 25, 2016 at 7:24
  • $\begingroup$ No, you start with a guess of the parameters of the two normal distributions , based on these you allocate the data to your two normal distributions (by max likelihood) , then you recalculate the parameters of the distributions using your data split, and repeat until convergence. $\endgroup$
    – seanv507
    Commented Jan 25, 2016 at 7:39
  • $\begingroup$ Can you give an example if I just have 10 numbers: $[1, 2, 8, 7, 4, 3, 2, 4, 9, 1]$? $\endgroup$
    – Jamgreen
    Commented Jan 25, 2016 at 9:36

1 Answer 1

0
$\begingroup$

As I understand your question, you have a vector of datapoints that come from two distributions $f_X$ and $f_Y$, where you do not know their group memberships. You can think of this data as of mixture of $f_X$ and $f_Y$ distributions and to solve it you can use one of the clustering algorithms designed for such problems. The simple non-parametric approach would be to use algorithms such as k-means, but you could use also model-based approach such as finite mixture model (e.g. Mclust). It is not a problem for either of the algorithms that the values are shuffled.

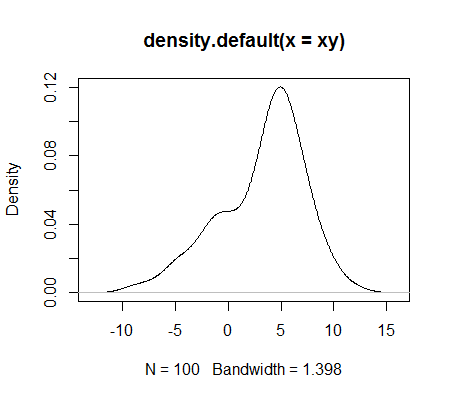
Let me illustrate those approaches with an example with simulated data.

set.seed(123)

x <- rnorm(50, 1, 5)
y <- rnorm(50, 5, 2)

ord <- sample(100)
xy <- c(x, y)[ord]
enter image description here

For this dataset k-means returns

Cluster means:
       [,1]
1 -1.842147
2  5.512294

Mclust algorithm implemented in mclust library for one-dimensional data assuming variable variance estimates means

$mean
       1        2 
1.397002 5.416184 

and variances

$variance$sigmasq
[1] 20.451195  2.700587

or estimated using flexmix library (see Leisch, 2004 and Grün and Leisch, 2008) returns

       Comp.1   Comp.2
mean 5.403225 1.437003
sd   1.651631 4.562311

Each of the methods classified correctly group membership 78-79% of cases. In this example groups were equal-sized but this does not have to be the case for any of the algorithms described. If you have knowledge of variances in both groups this would make estimation easier. Here it was assumed that both groups are normally distributted, but you can make other distributional assumptions in finite mixture model as well. It is most popular to use E-M algorithm or Bayesian approach to estimate finite mixture models.

$\endgroup$

Your Answer

By clicking “Post Your Answer”, you agree to our terms of service and acknowledge you have read our privacy policy.

Not the answer you're looking for? Browse other questions tagged or ask your own question.