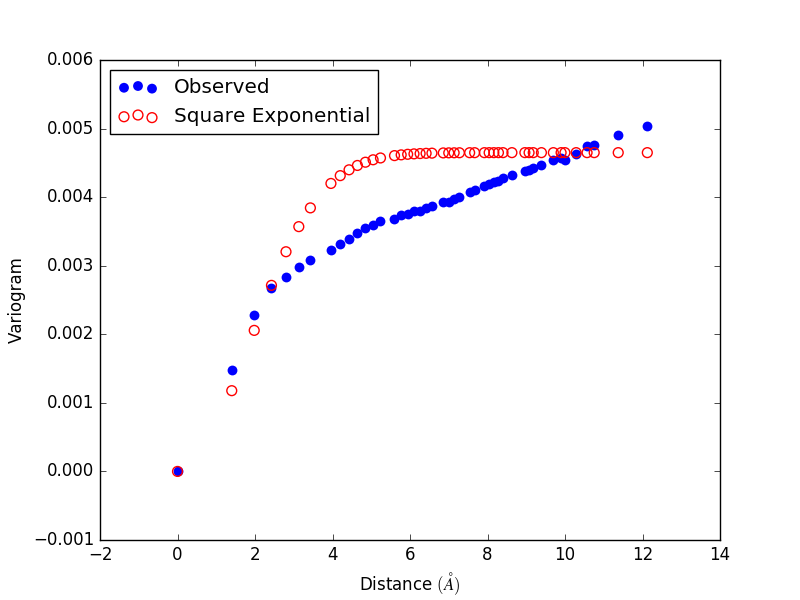
I am modeling my 3D dataset with a Gaussian Process with square-exponential covariance. To test whether this is a good model, I subtract the mean from the observed data and then calculate the empirical variogram:
$$ \gamma(d) = \frac{1}{2|N(d)|}\sum_{i,j\in N(d)}|z_i - z_j|^2 $$
Where $N(d)$ is the set of pairs at distance $d$. I compared it against the theoretical variogram:
$$ \gamma(d) = \frac{1}{(2\pi\sigma^2)^{3/2}}\left[1.0 - exp\left(-\frac{d^2}{ 2\sigma^2}\right)\right] $$
However when I plot it I get this weird effect where the variogram is low and slowly increases without end. Any idea what's going on? At first I thought the mean was incorrect, but when I change it the whole observed plot just shifts up and down, keeping that slow increase.

