I am getting some perplexing results for the correlation of a sum with a third variable when the two predictors are negatively correlated. What is causing these perplexing results?
Example 1: Correlation between the sum of two variables and a third variable
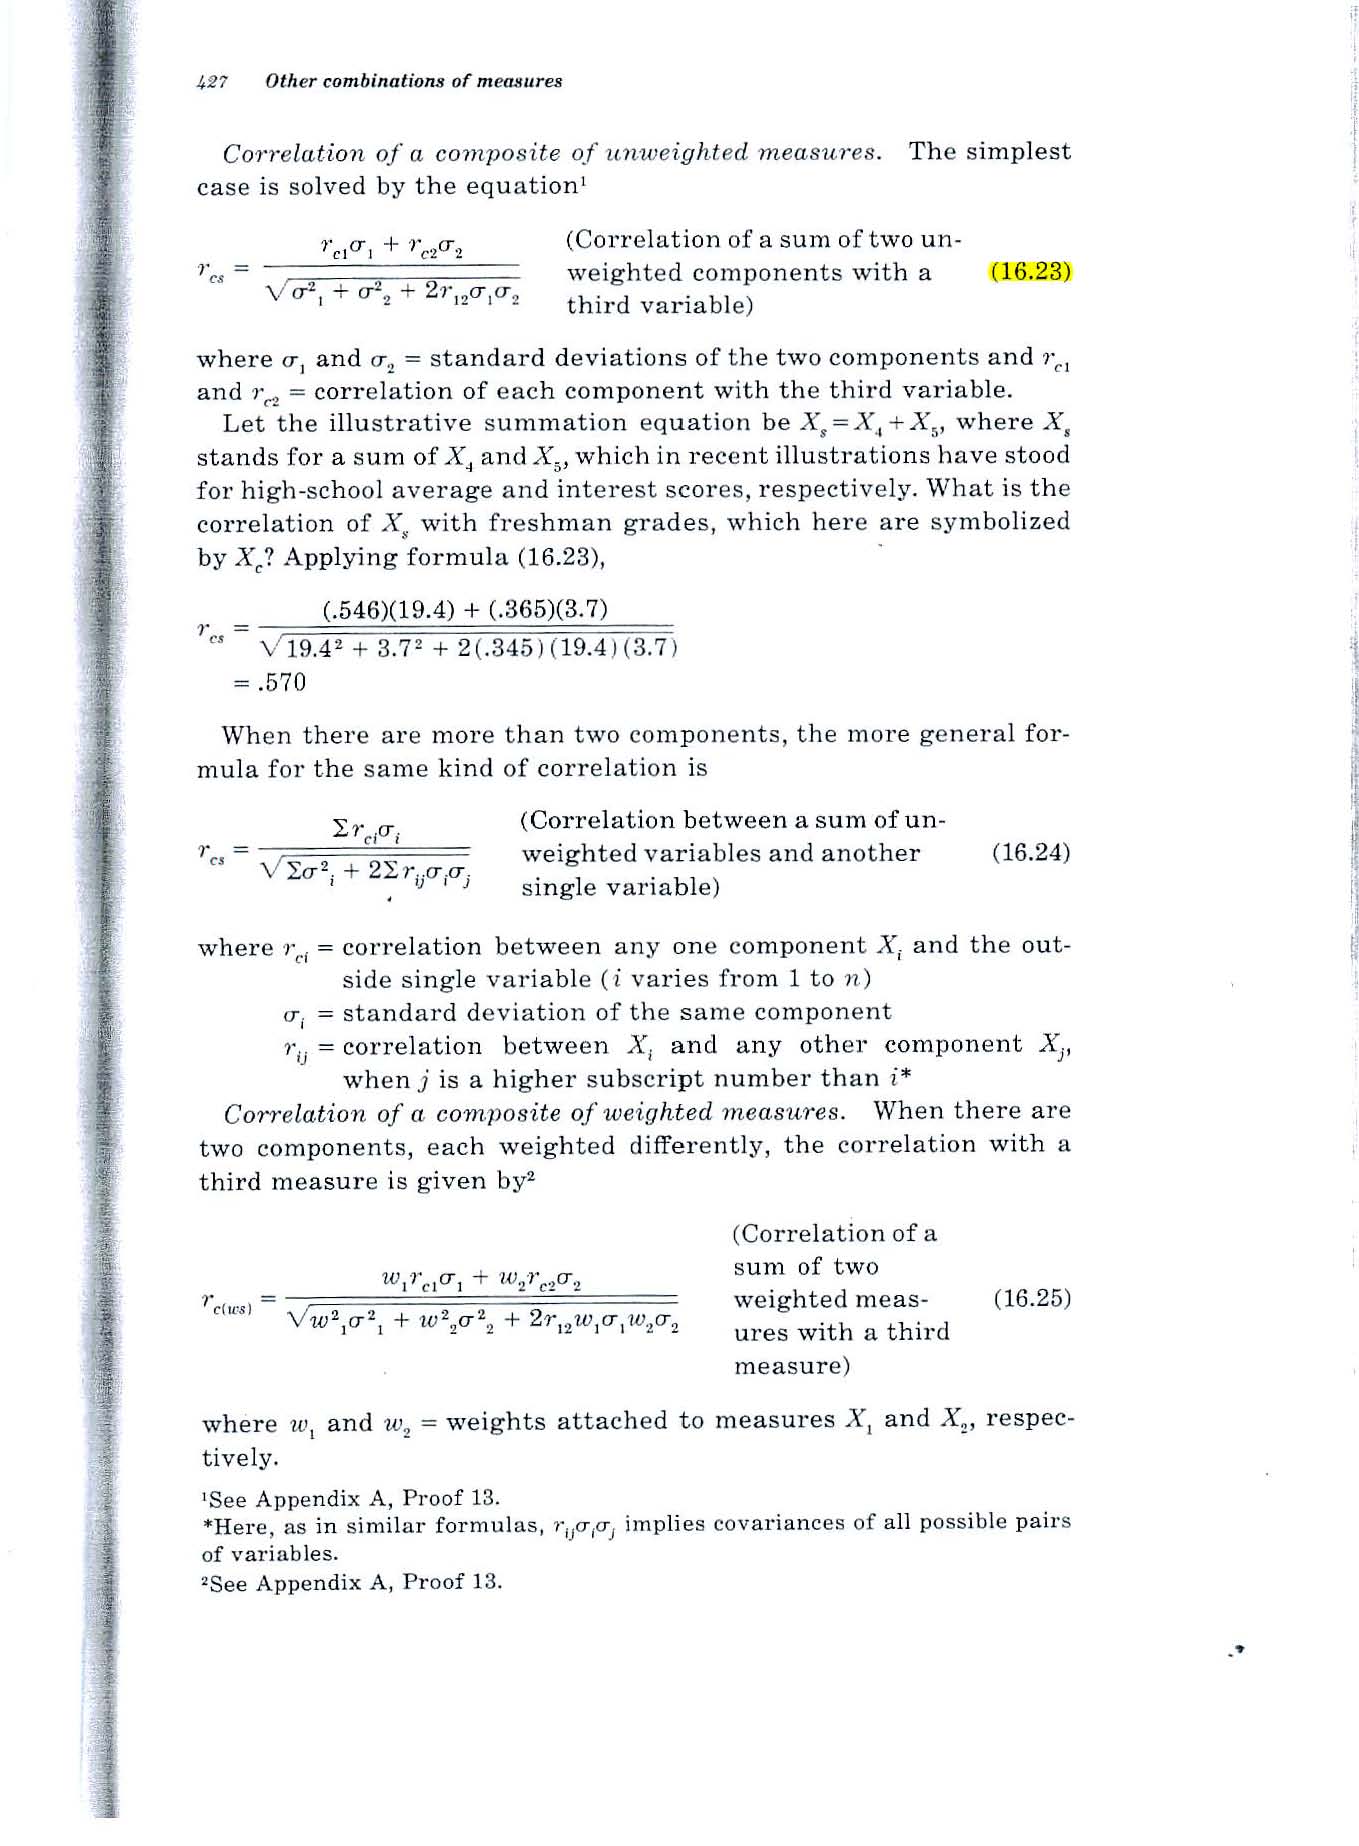
Consider formula 16.23 on page 427 of Guildford's 1965 text, shown below.
Perplexing finding: If both variables correlate .2 with the third variable and correlate -.7 with each other, the formula results in a value of .52. How can the correlation of the total with the third variable be .52 if the two variables each correlate only .2 with the third variable?
Example 2: What is the multiple correlation between two variables and a third variable?
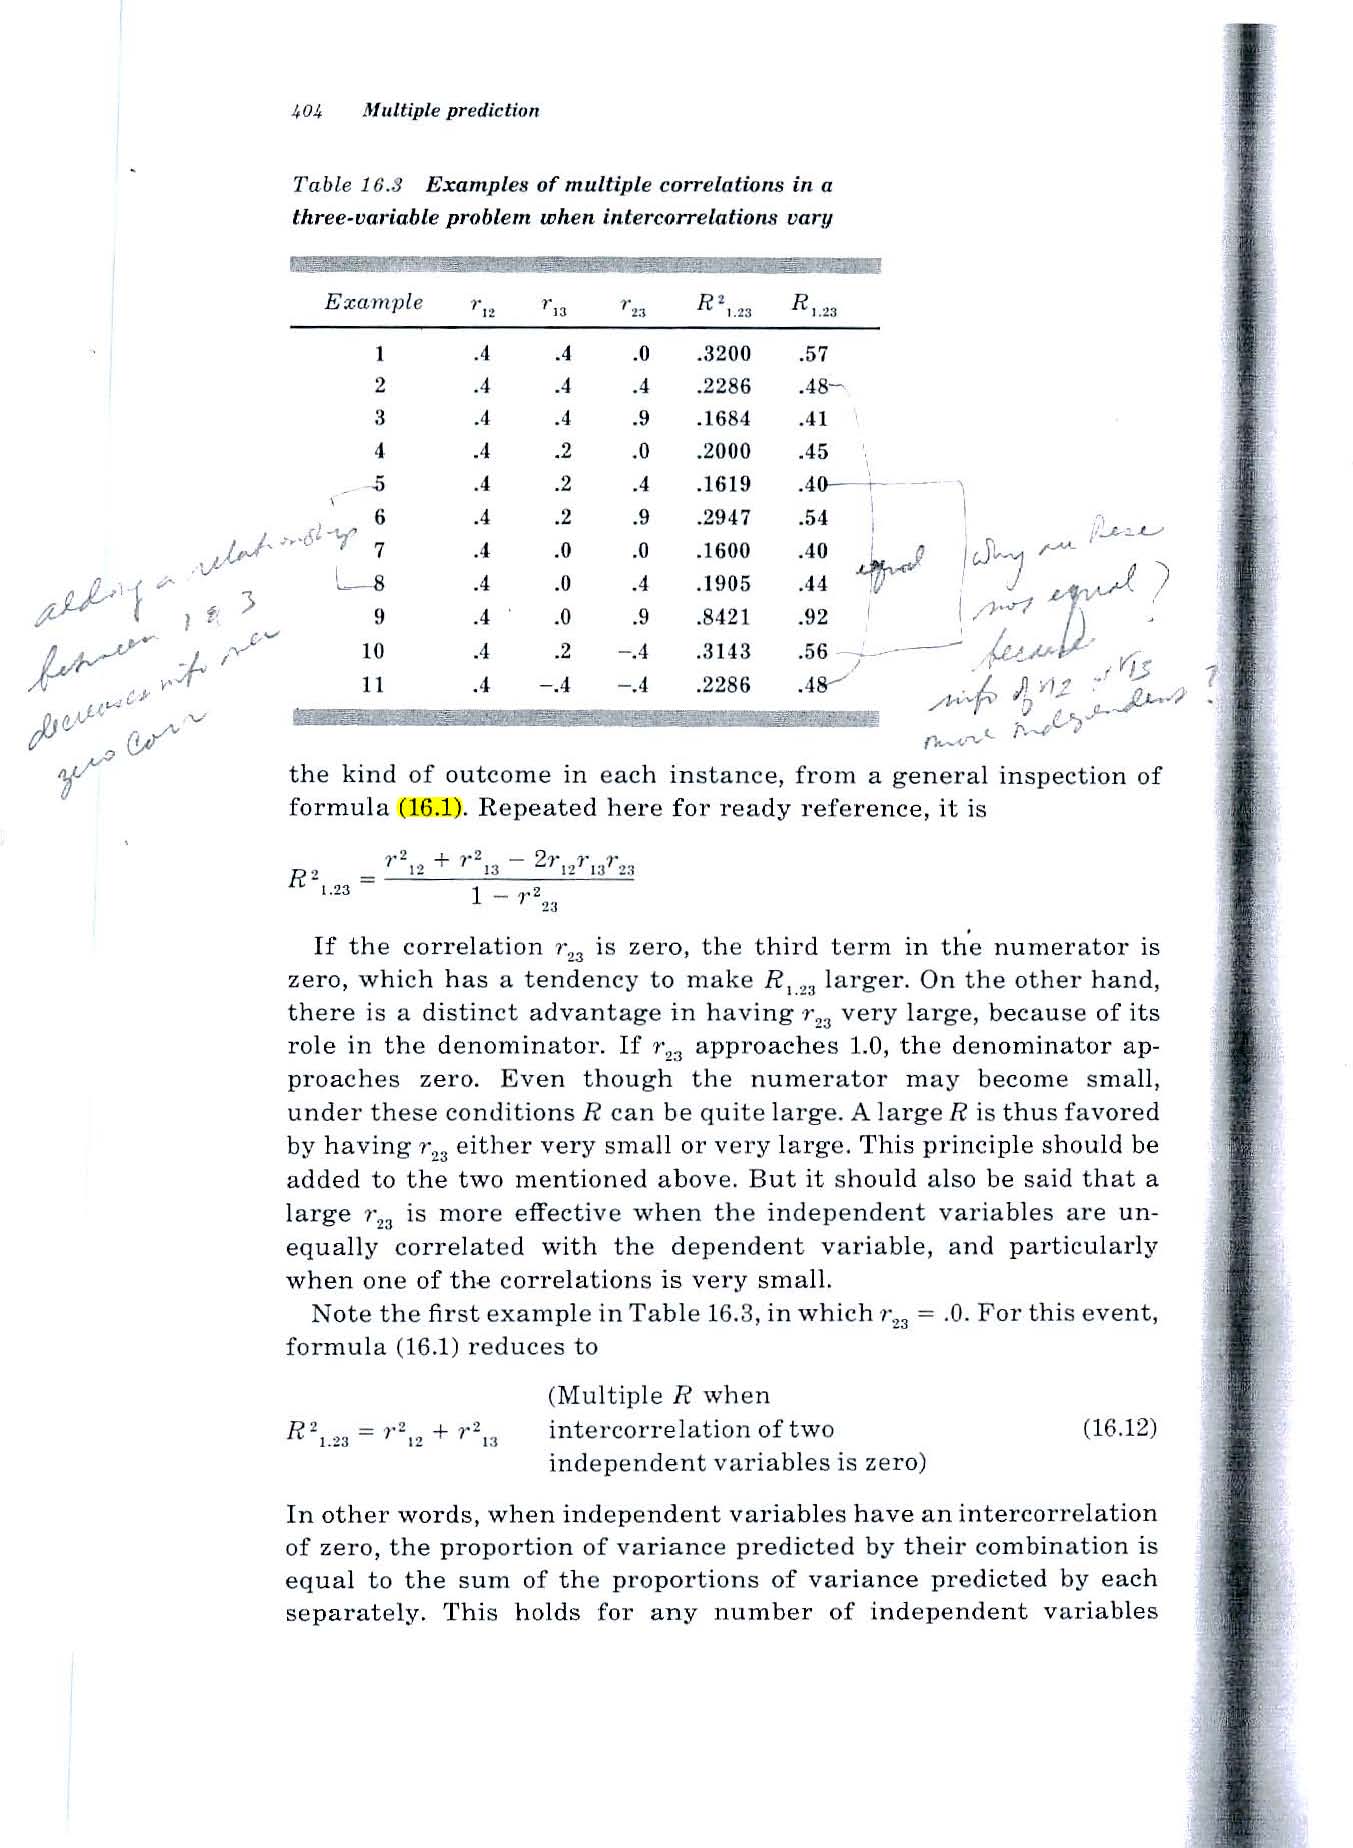
Consider formula 16.1 on page 404 of Guildford's 1965 text (shown below).
Perplexing finding: Same situation. If both variables correlate .2 with the third variable and correlate -.7 with each other, the formula results in a value of .52. How can the correlation of the total with the third variable be .52 if the two variables each correlate only .2 with the third variable?
I tried a quick little Monte Carlo simulation and it confirms the results of the Guilford formulas.
But if the two predictors each predict 4% of the variance of the third variable, how can a sum of them predict 1/4 of the variance?
Source: Fundamental Statistics in Psychology and Education, 4th ed., 1965.
CLARIFICATION
The situation I am dealing with involves predicting future performance of individual people based on measuring their abilities now.
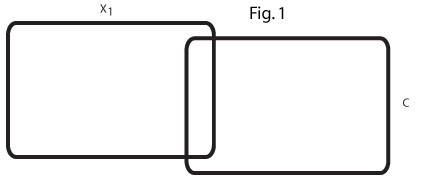
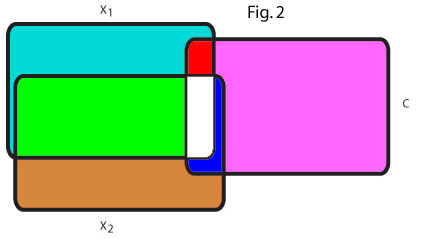
The two Venn diagrams below show my understanding of the situation and are meant to clarify my puzzlement.
This Venn diagram (Fig 1) reflects the zero order r=.2 between x1 and C. In my field there are many such predictor variables that modestly predict a criterion.
This Venn diagram (Fig 2) reflects two such predictors, x1 and x2, each predicting C at r=.2 and the two predictors negatively correlated, r=-.7.
I am at a loss to envision a relationship between the two r=.2 predictors that would have them together predict 25% of the variance of C.
I seek help understanding the relationship between x1, x2, and C.
If (as suggested by some in reply to my question) x2 acts as a suppressor variable for x1, what area in the second Venn diagram is being suppressed?
If a concrete example would be helpful, we can consider x1 and x2 to be two human ability and C to be 4 year college GPA, 4 years later.
I am having trouble envisioning how a suppressor variable could cause the 8% explained variance of the two r=.2 zero order r's to enlarge and explain 25% of the variance of C. A concrete example would be a very helpful answer.

