7
$\begingroup$

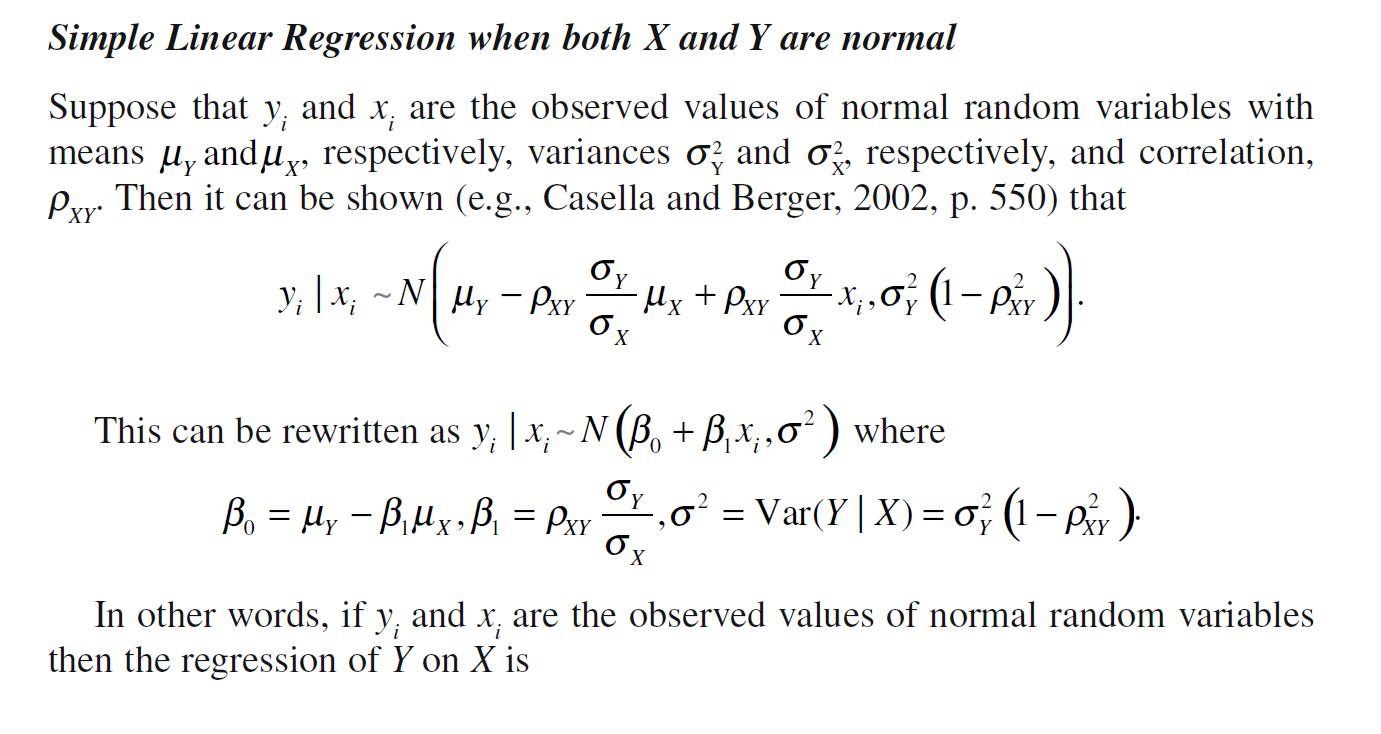
In Sheather's book, it states that

The Box-Cox procedure aims to find a transformation that makes the transformed variable close to normally distributed.

To be specific: enter image description here enter image description here Also, when x and y are normally distributed, the maximum likelihood estimates of $\beta_0$ and $\beta_1$ are the same as the least squares estimates.

But in simple linear regression, actually we don't assume this to be necessarily true. Why is that?

(Since based on the picture above, it seems only when x and y are normally distributed will Y on X to be close to linear, which is just the linear regression model)

Also, Box-Cox method's goal is to make X and Y more normally distributed, yet usually when people use this method for data transformation, they actually want to make the errors(or std.residuals) normally distributed. How does these two relate to each other?

$\endgroup$
10
  • 1
    $\begingroup$ In reality, box-cox transformation finds a transformation that homogenizes variance, and constant variance is an assumption! The crux of the matter is that boxcox uses a constant-variance normal likelihood. $\endgroup$ Commented Oct 26, 2017 at 6:28
  • 1
    $\begingroup$ Neither the quotation nor the preceding comment are fully general. Although the Box-Cox transformation can be implemented with the aims given in the quotation and using an ML method alluded to by @Kjetil, yet it's far more general than that: (1) it can be used to symmetrize distributions and/or create near-constant variances and/or linearize relationships; (2) it should be estimated using robust exploratory methods rather than the much more limited parametric maximum likelihood methods offered in most software packages. See stats.stackexchange.com/a/3530, for instance. $\endgroup$
    – whuber
    Commented Oct 26, 2017 at 14:40
  • 2
    $\begingroup$ Let me be perfectly clear: the purpose of the Box-Cox transformation is not to make data look as normal as possible, nor is it necessary to calculate it with that aim in mind. Moreover, the aims of (1) achieving a symmetric (or Normal) distribution of residuals, (2) linearizing a relationship, and (3) achieving constant conditional variance are distinctly different and will not necessarily be achieved by the same (or any) Box-Cox transformation. The quotation is a narrow, specialized approach to finding a Box-Cox transformation and its inference ("since then...") is flatly incorrect. $\endgroup$
    – whuber
    Commented Oct 26, 2017 at 16:13
  • 2
    $\begingroup$ @Matthew It's a losing battle: new books on some version of R plus statistics are appearing faster than any one person could even read them. A better response is to write a better book--but that's obviously a significant effort! $\endgroup$
    – whuber
    Commented Oct 27, 2017 at 16:46
  • 2
    $\begingroup$ @whuber or ask questions on Cross Validated :) $\endgroup$
    – Andre
    Commented Oct 27, 2017 at 19:32

4 Answers 4

6
$\begingroup$

In reality the box-cox transformation finds a transformation that homogenize variance. And constant variance is really an important assumption! The comment of @whuber: The Box-Cox transform is a data transformation (usually for positive data) defined by $Y^{(\lambda)}= \frac{y^\lambda - 1}{\lambda}$ (when $\lambda\not=0$ and its limit $\log y$ when $\lambda=0$). This transform can be used in different ways, and the Box-Cox method usually refers to likelihood estimation of the transform parameter $\lambda$. $\lambda$ could potentially be chosen in other ways, but this post (and the question) is about this likelihood method of choosing $\lambda$.

What happens is that boxcox transform maximizes a likelihood function constructed from a constant variance normal model. And the main contribution in maximizing that likelihood comes from homogenizing the variance! ( * ) You could construct some similar likelihood function from some other location-scale family (maybe, for example, constructed from $t_{10}$, say) and the constant variance assumption, and it would give similar results. Or you could construct a boxcox-like criterion function from robust regression, again with constant variance. It would give similar results. (eventually, I want to come back here showing this with some code).

( * ) This shouldn't really be surprising. By drawing a few figures you can convince yourself that changing the scale of a density is a much larger change, influencing density values (that is, likelihood values) much more than just changing the basic form a little, but keeping the scale.

I once built (with Xlispstat) a slider demonstration showing this convincingly, but what you should do is simply to make some simple examples and you will see this result for yourself.

What happens is simply that the contribution to the likelihood function from constant variance assumption greatly overshadows changes to the likelihood by small changes to the form of the basic density $f_0$ used to generate the location-scale family.
$\endgroup$
3
  • 1
    $\begingroup$ Since the question really comes down to distinguishing the "Box Cox Method" of the quotation from the far more general Box-Cox transformation, it would help to make that distinction clearly rather than conflating the two. $\endgroup$
    – whuber
    Commented Oct 26, 2017 at 14:42
  • 1
    $\begingroup$ I will extend this answer when I hava a little time $\endgroup$ Commented Oct 26, 2017 at 15:52
  • $\begingroup$ Constant variance is not an assumption if you use sandwich based standard errors. $\endgroup$
    – AdamO
    Commented Oct 27, 2017 at 19:50
3
$\begingroup$

I'm assuming you're referring to Box-Cox normality plots by "method" in your question. It is true that normality assumption in OLS is not required for the method to be useful. For instance, regardless of the error distribution it will produce the coefficients that are unbiased under certain other conditions.

With that said though normality assumption is not useless. For instance, in small samples without normality assumption you can't say much about the probability distribution of the ceofficients beyond the variance and covariance. With normality assumption you can estimate this probability distribution. On large samples under certain conditions you can do this without normality assumption using central limit theorem. Normality assumption makes maximum likelihood estimation (MLE) to produce the same coefficients as OLS, and share many properties of the estimators in (again) small samples.

finally, many people use Box-Cox transformation not to normalize the data, but to stabilize the variance. Sometimes variance increases for larger levels of the dependent variable. In this case Box-Cox transformation can help make variance uniform across the sample. This is related to the assumption of homoscedasticity in OLS

$\endgroup$
1
$\begingroup$

Sorry that my question is a bit unorganized, but one of my question(and most confused part) is why do we want our predictors and responses variable to be symmetric or normally distributed. And after dwelling on this for two days, I think now I quite got the answer.

Here is what I found is most useful: https://stats.stackexchange.com/a/123252/161581

The core idea is:

the log-or-power-transformed, more normally distributed variables are more likely to fulfill linear regression's assumptions, particularly linearity, homoscedasticity, and normally distributed residual.

As for the reason, the quote picture in my question can answer for the linearity part. Or as @Penguin_Knight said, skewed independent variable would have some data points with very high leverage, potentially able to bias the regression slope.

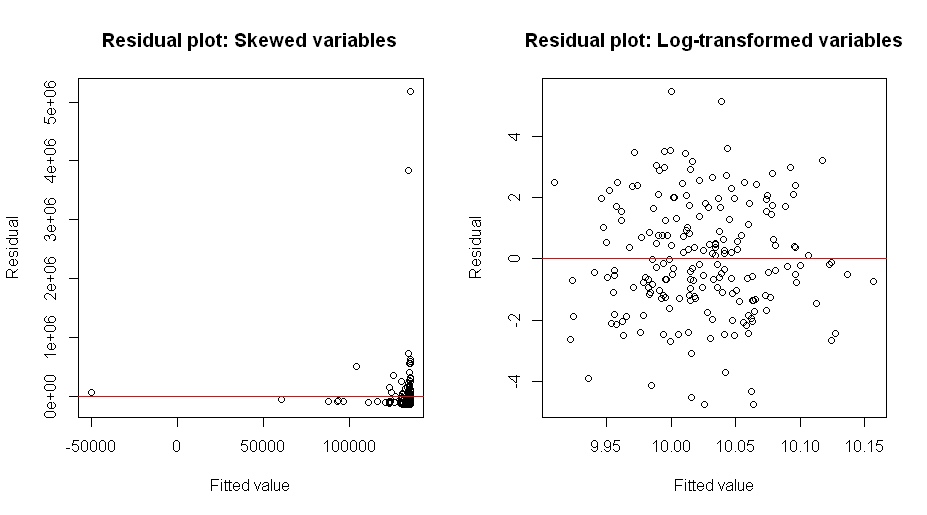
For others, in the link above, there are two pictures(which I copied below) that show how transformation can help to make the variance of errors more like a constant and residual plot a better look (i.e. no discernible pattern). enter image description here

$\endgroup$
5
  • 1
    $\begingroup$ The answer to your question: "why do we want our data [you mean residuals] to be symmetric or normally distributed?" is that we don't. The rationale for applying power transforms to an outcome is because it addresses a scientific question of interest. It happens that linear regression is an exact (not asymptotic) procedure when residuals are normally distributed (and identically independently distributed). It turns out you need relatively few observations to enjoy very good approximations to asymptotic test statistic distributions, CIs, and p-values. $\endgroup$
    – AdamO
    Commented Oct 27, 2017 at 19:48
  • $\begingroup$ However if you have small samples and need exact inference, you can relax the need for normally distributed residuals by using resampling statistics (like the permutation test). $\endgroup$
    – AdamO
    Commented Oct 27, 2017 at 19:50
  • $\begingroup$ @AdamO I’m sorry I didn’t make it clear. You make a good point in explaining. But the “data” in my answer actually refers to predictors and response variables. Would you also comment on this? $\endgroup$
    – Andre
    Commented Oct 27, 2017 at 19:56
  • $\begingroup$ The assumptions for the classical linear model are simply that $Y = a + b X + \epsilon$ and that $\epsilon$ has a IID normal mean-zero distribution. $X$ can be anything, and $Y$ will consequentially be a linear combination of that and the error. In that case, CIs and p-values are exact rather than merely approximate. $\endgroup$
    – AdamO
    Commented Oct 27, 2017 at 21:03
  • $\begingroup$ @AdamO yes, I know the assumptions. But it seems in practice we still want our data to “look better”, i.e. making x and y more symmetric or normally distributed. And my original question is basically asking reason for that. $\endgroup$
    – Andre
    Commented Oct 27, 2017 at 21:33
1
$\begingroup$

The very purpose to check if a given data is normal, if we use t-tests or analysis of variance to find significant difference between groups of data.

If we apply t-tests or ANOVA without knowing if the given data is normally distributed or not, will have a conclusion based on the results, it will be uncertain if we are close or not to our hypothesis test.

Because these derived formula t-tests and ANOVA are derived from a normal distribution. So if normality test fails, then a parametric method of statistical analysis is to be used

And we really need to use t-tests or ANOVA, a non normal data must be transformed to normal to be consistent in using the formula..

I just learned this idea from my professor.

$\endgroup$
1
  • $\begingroup$ Your answer could be improved with additional supporting information. Please edit to add further details, such as citations or documentation, so that others can confirm that your answer is correct. You can find more information on how to write good answers in the help center. $\endgroup$
    – Community Bot
    Commented Jul 9 at 6:48

Not the answer you're looking for? Browse other questions tagged or ask your own question.