1
$\begingroup$

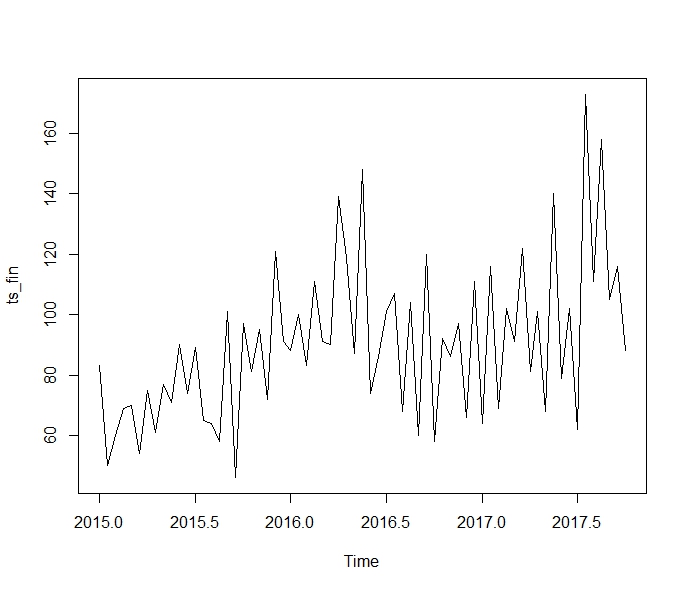
I would like to share my analysis in order to have guidance on how to improve the time series results.

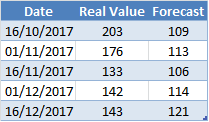
Here you will find a table comparing real values vs forecasted ones.

Table

Below you will find the code that generated that output (in R).

# Load required libraries
library(forecast)
library(lubridate)
library(tidyverse)
library(scales)
library(ggfortify)

# Load dataset
emea <- read.csv(file="C:/Users/nsoria/Google Drive/Trabajo/AMS Globales/812_Finanzas.csv", header=TRUE, sep=';', dec=",")

# Create time series object
ts_fin <- ts(emea$Valor, deltat = 1/24, start = c(2015, 1))

# Pull out the seasonal, trend, and irregular components from the time series 
model <- stl(ts_fin, s.window = "periodic")

# Predict the next 3 bi weeks of tickets
pred <- forecast(model, h = 5)

# Round values to better accuracy
pred$mean <- round(pred$mean)
pred$upper <- round(pred$upper)
pred$lower <- round(pred$lower)

I have added in this link the dataset which is used here.

My main concern would be how to improve accuracy for forecasted results. I am looking into a possibility to add a machine learning algorithm but I am open to suggestions.

Thanks in advance.

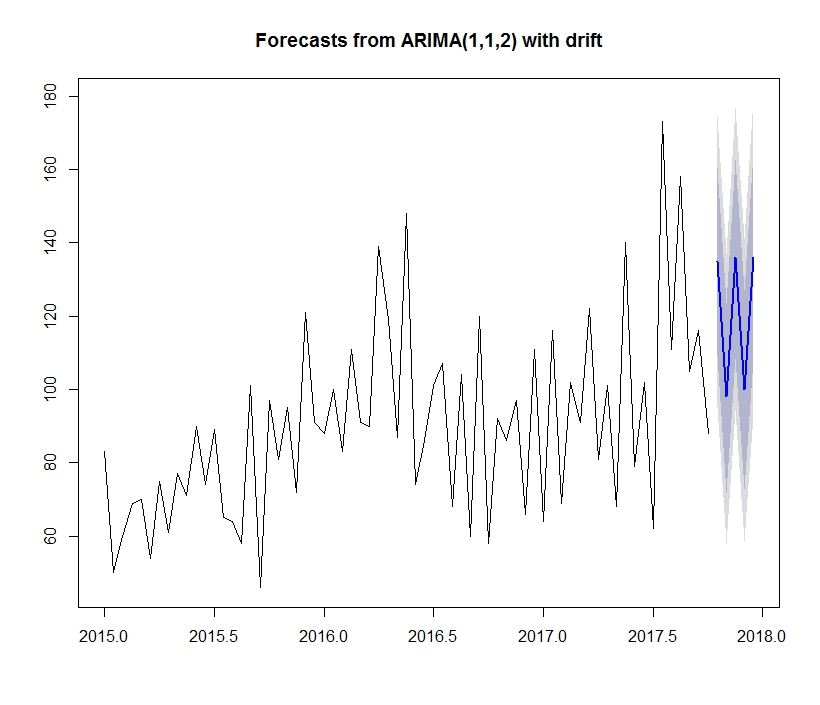
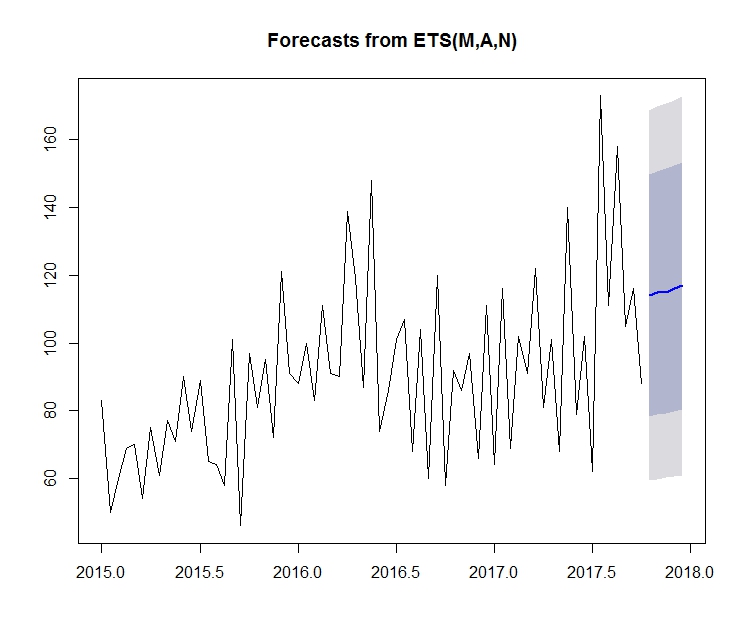
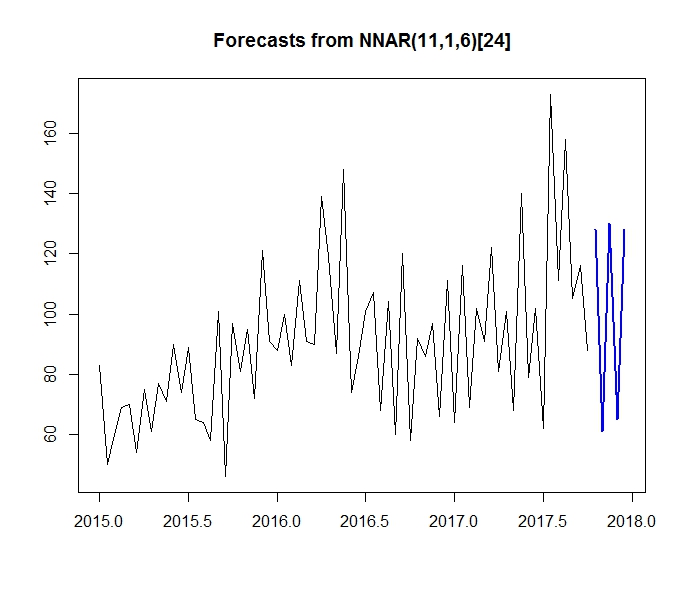
Edit 24/01: As suggested, you will find the actual results for the prediction and the different outputs.

Real Values Auto Arima Forecast ETS Forecast NNar Forecast

$\endgroup$
1
  • 1
    $\begingroup$ Robert J Hyndman has launched very effective time series ensemble package for R (forecastHybrid). The accuracy of the model will increase as it ensembles multiple models. Have a look. $\endgroup$
    – Hunaidkhan
    Commented Dec 5, 2018 at 10:10

2 Answers 2

1
$\begingroup$

Without looking at your data, it seems that the only method you have used is stl().

There are other models available in the forecast package, including ets() (exponential smoothing methods), auto.arima() (arima models), nnetar() (neural networks).

That would be the first thing to try to see if your can improve your forecasts.

$\endgroup$
3
  • $\begingroup$ Thank you Alex for your comments. I will look into it and update the question with the output. $\endgroup$
    – nariver1
    Commented Jan 23, 2018 at 21:19
  • $\begingroup$ Alex, I have added the information related to the different models outputs. It seems that ETS is the actually more close to the real data, is there any way to keep improving it? $\endgroup$
    – nariver1
    Commented Jan 24, 2018 at 15:00
  • 1
    $\begingroup$ There is a limit to how much you can improve your forecast because your data is infected with noise and you don't know the future. Numerical experimentation shows you probably shouldn't spend heroic efforts to improve your forecast error beyond 50% improvement over the naive forecast. See here and here. Disclosure: I have no affiliation with this site. $\endgroup$ Commented Sep 22, 2018 at 14:59
0
$\begingroup$

Also, try plotting the series. Check how the trend looks like using decompose methods. Check for the stationarity of the series with Dickey-Fuller test or KPSS test. Use auto.arima to find p,d,q or try finding with acf, pacf plots. You have missed a lot.

$\endgroup$

Your Answer

By clicking “Post Your Answer”, you agree to our terms of service and acknowledge you have read our privacy policy.

Not the answer you're looking for? Browse other questions tagged or ask your own question.