2
$\begingroup$

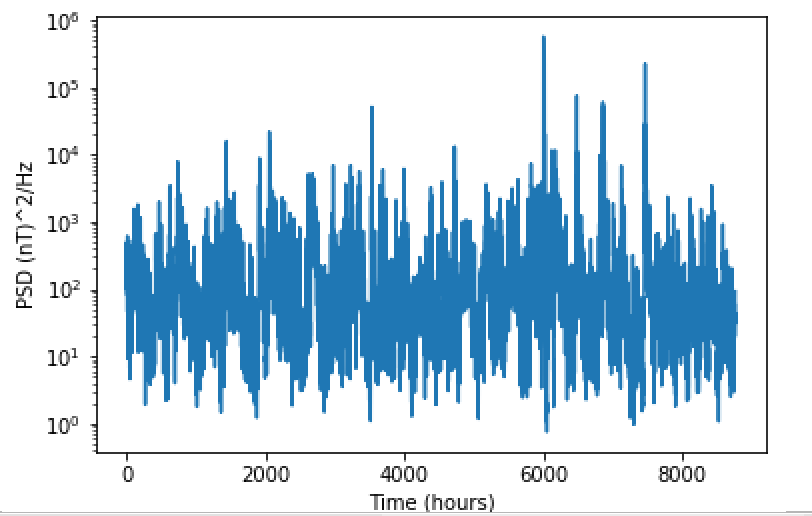
I am trying to fit an ARMA model to a time series of a power spectral density values that I have calculated.

Here is the plot of the data: enter image description here

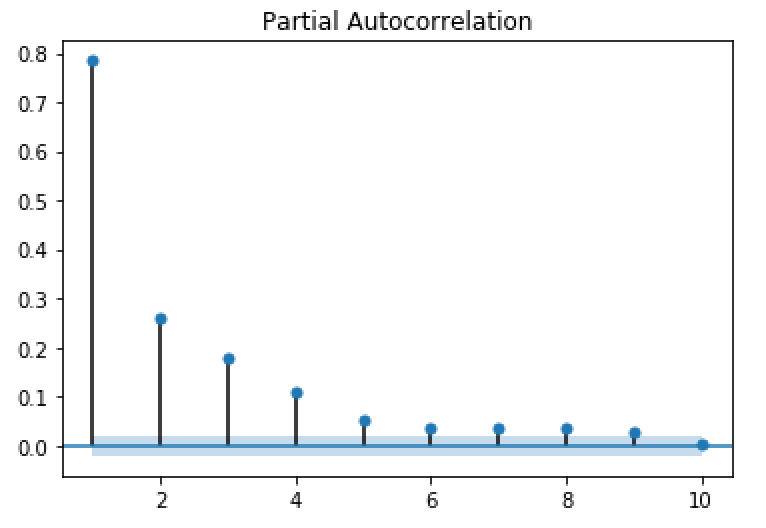
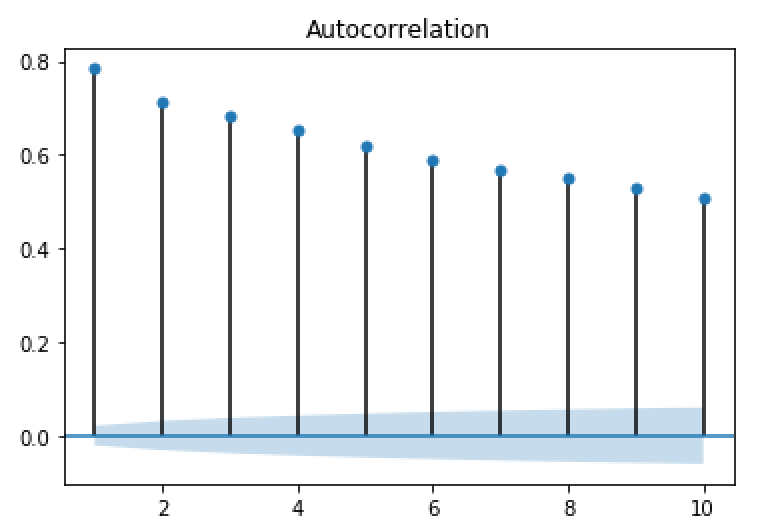
with corresponding autocorrelation and partial autocorrelation plots enter image description here enter image description here
I am fairly new to time series analysis but the way I am interpreting it is as follows:

The slowly varying ACF (it hits zero around lag 55) indicates non stationarity initially, but since there are significant spikes in the PACF for the first few lags, this indicates that the PACF may explain the behaviour of the ACF and we in fact need more AR terms. In this case there seem to be significant AR lags in the first 5 and so this would suggest a possible ARMA(5,0) model?

However I have also read that the amount of MA terms you need correspond to the first lag outside of the confidence interval where each following lag decay to 0 - hence might I need an ARMA(5,1) model?

As a third problem to my the data looks like it may be somewhat periodic, if this is the case how do you go about fitting an ARMA model?

$\endgroup$
2
  • $\begingroup$ Welcome to CV and thank you for your great question. If you need someone analyzing your data you d better go for a (paid) consultant. This page is for answers to small questions and not for you sending someone data in order to analyze it in R. $\endgroup$
    – Ferdi
    Commented Jun 5, 2018 at 12:24
  • 1
    $\begingroup$ Hi thanks for your response. I do not need anyone to analyse my data I just need help with understanding the plots and the concepts of ARIMA models. Sorry, should have been clearer $\endgroup$
    – R Thompson
    Commented Jun 5, 2018 at 12:26

1 Answer 1

1
$\begingroup$

Forecasting: Principles and Practice, section 8.5 offers some very rough guidance on using ACF/PACF plots to fit models. In your specific case, it looks like you may have an ARIMA($p$,$d$,$q$) process with both $p\neq 0$ and $q\neq 0$. In this case, the (P)ACF plots are not helpful for selecting model orders.

I suggest that you use a more modern method, by fitting different models and choosing the one that minimizes an information criterion like the AIC.

$\endgroup$
4
  • $\begingroup$ Could you explain what about the plots leads you to believe p and q terms are justified. $\endgroup$
    – rolando2
    Commented Jun 7, 2018 at 11:07
  • $\begingroup$ @rolando2: both drop. PACF exponentially, ACF less so. There is no clear order up to which autocorrelations are significant but beyond which they aren't. This pattern does not match any listed in the FPP2 link. Anyway, ICs are better than Box-Jenkins and eyeballing. $\endgroup$ Commented Jun 7, 2018 at 11:13
  • $\begingroup$ All of which with a tad more connective tissue would probably be good to add to your answer. $\endgroup$
    – rolando2
    Commented Jun 7, 2018 at 13:41
  • $\begingroup$ @rolando2: I agree. However, please take a look at this. $\endgroup$ Commented Jun 7, 2018 at 13:44

Not the answer you're looking for? Browse other questions tagged or ask your own question.