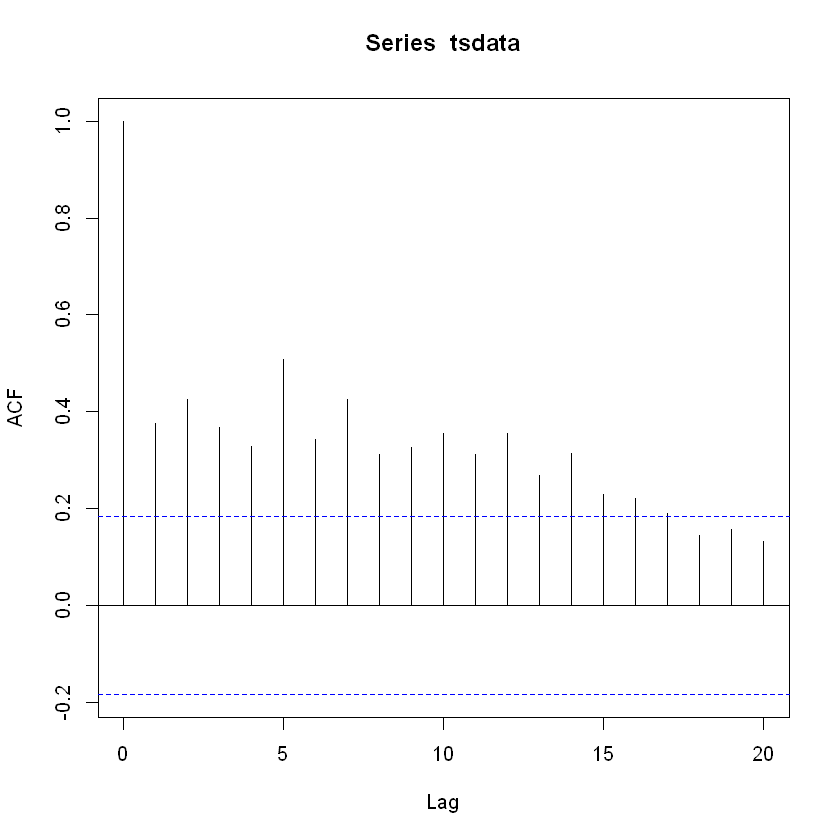
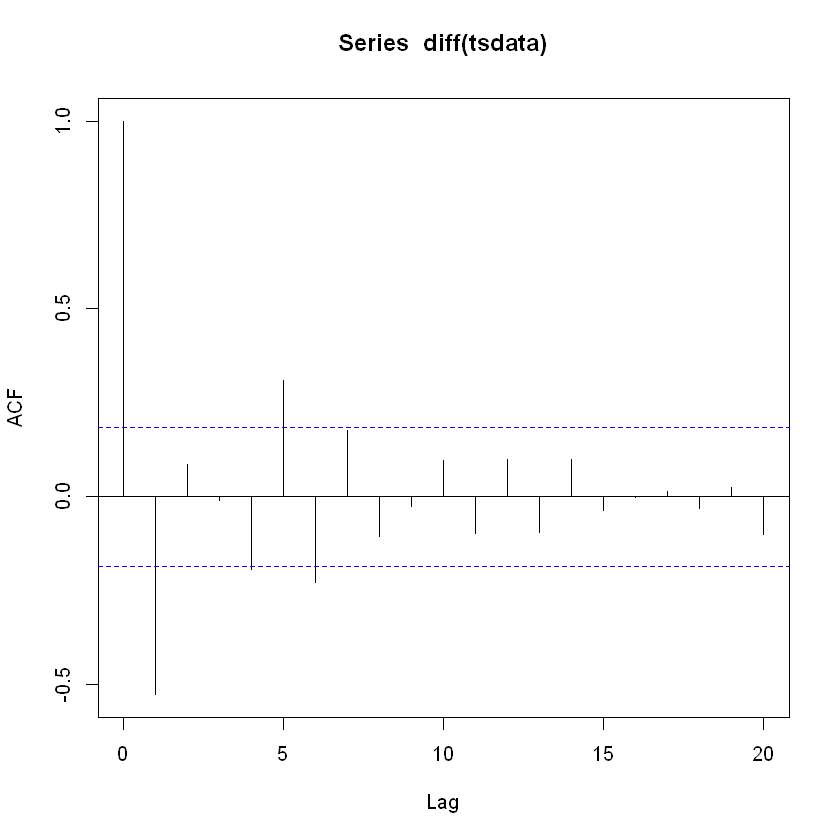
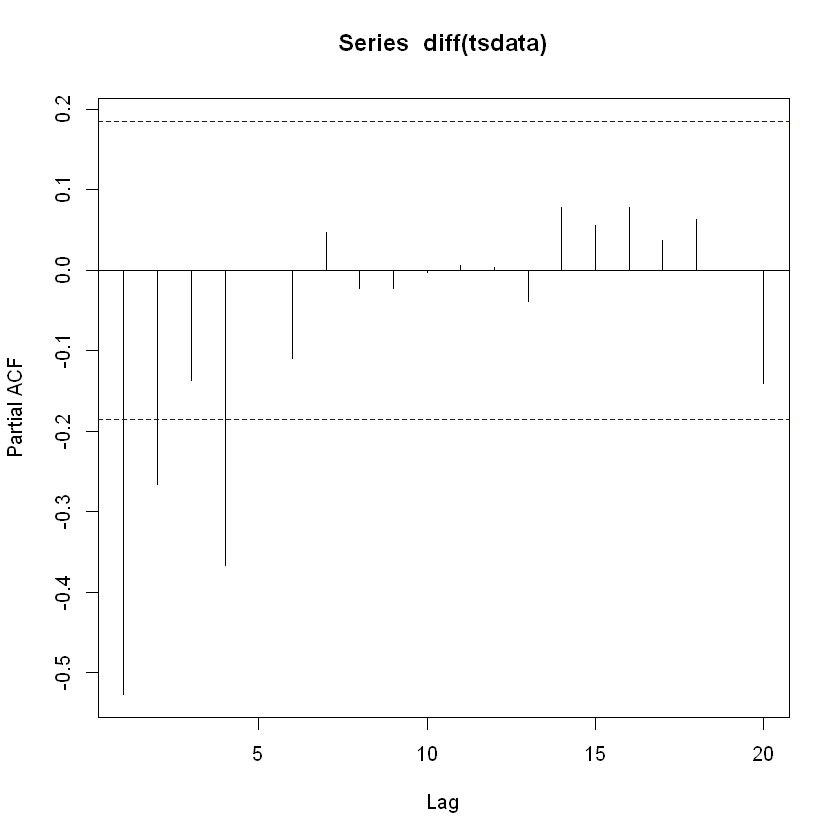
I'm not sure how to interpret the autocorrelation pattern I'm seeing in this time series and any help would be very appreciated. Below is the ACF plot for my data. To me this looks like seasonal nonstationary but I'm a beginner so I can't be sure.
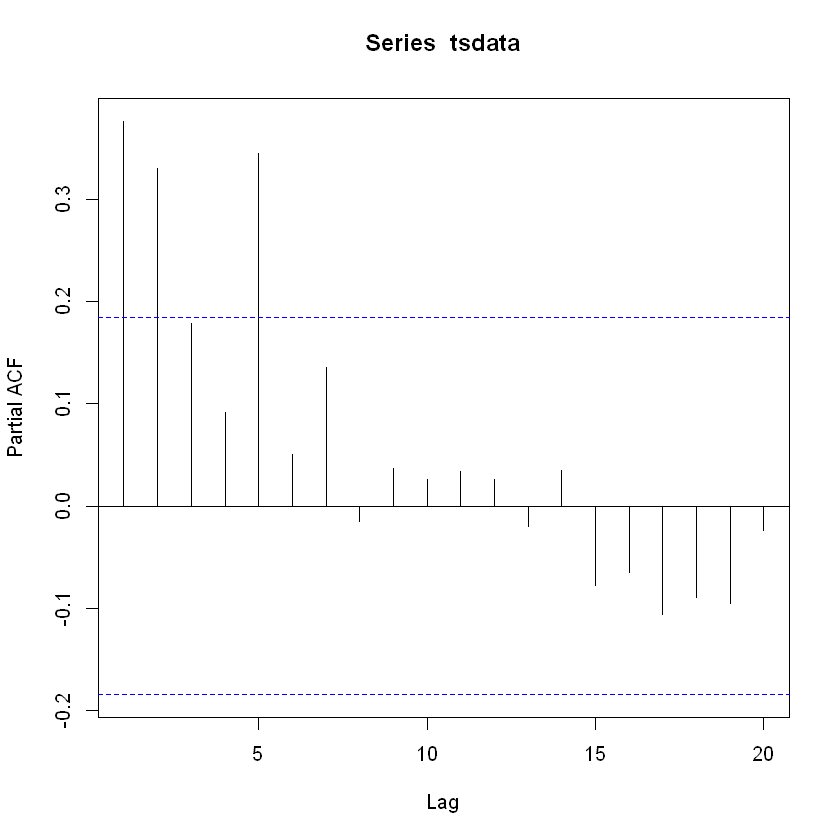
The PACF is where I'm more confused. How should I interpret the declining correlation followed by the spike at lag 5? The literature I've read doesn't seem to help.


