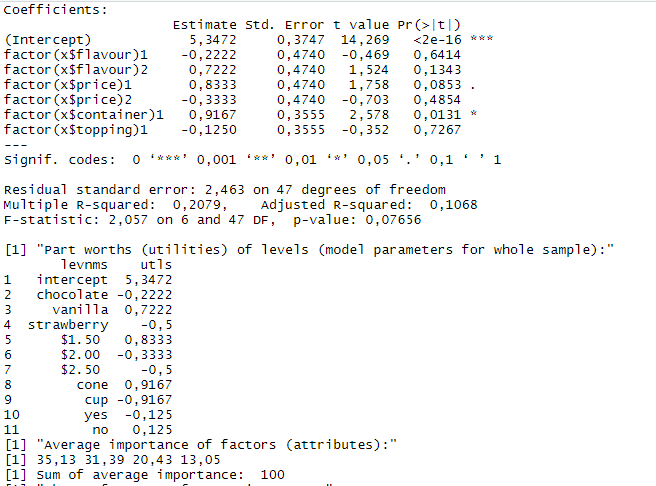
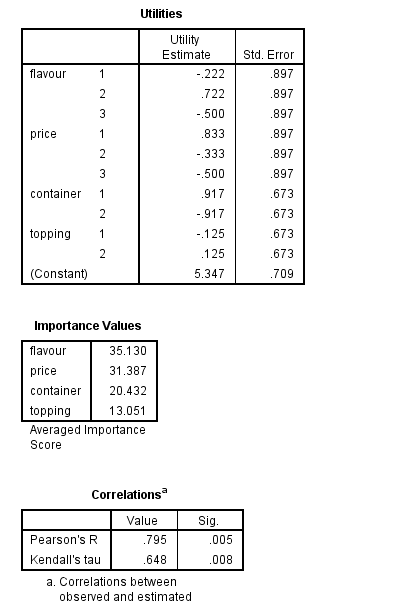
I have been going through the tutorial by the author of the conjoint library in R (Tomasz Bartłomowicz) which can be found here. Specifically I have been going through example 1 (Ice Cream) and trying to replicate it in SPSS. I succeed in getting the same results in terms of coefficients and intercept values in both. However the standard errors reported in R differ from those reported in SPSS. Why should this be, considering the analysis is done on the same data set?
1 Answer
The R implementation seems to be giving results for the separate subjects stacked on top of one another and run in a single regression using all 54 observations (nine from each of the six subjects).
In SPSS, the overall results are equivalent to averaging the data (after transforming rankings to scores) across subjects and running a single regression, with nine cases. This accounts for the larger standard errors.
The equality of the regression coefficients is due to the orthogonality built into the design. You can stack the data and run one regression on all 54 observations, you can run the model for each subject individually and average the coefficients, or you can average the scores and run a single regression, and all will give the same coefficient values.
Note that this is not true of the importance values, which have to be calculated separately for each subject and averaged over subjects to get reasonable values.
-
$\begingroup$ Thank you very much for providing this clarity. $\endgroup$ Commented May 3, 2020 at 9:59
-
$\begingroup$ Is the R implementation, then, the more "correct" of the two? $\endgroup$ Commented May 3, 2020 at 10:18
-
$\begingroup$ Yes, the SPSS results are conservative here. If the outcome were measured as a score rather than a ranking or sequence, then there might be subject-to-subject variability that the R approach would not capture, so I wouldn't call it unconditionally correct, but the SPSS approach would likely remain more conservative. $\endgroup$ Commented May 4, 2020 at 18:30
-
$\begingroup$ But they both are measuring a score, not a ranking or sequence. The tutorial (R Conjoint) has the data converted from ranking to rating. I then use the same converted preferences in SPSS, as scores. Or did I misunderstand your comment? $\endgroup$ Commented May 5, 2020 at 21:07
-
$\begingroup$ All such analyses that I'm aware of analyze scores, but these data were in the original form of ranks, which means that the means and variances of the data for each subject were the same. That would be true of sequence data as well, which are just another way of expressing rankings. If the original input data were arbitrary scores that were not to be transformed for analysis, then the means and variances might not be the same. That was what I was saying in the previous comment. $\endgroup$ Commented May 6, 2020 at 20:54


