9
$\begingroup$

Based on actual data, given below is the distribution of the languages spoken in India by nearly $1.4$ billion people. There are more than $1600$ active languages in India which have been classified into $122$ broad languages. Out of these there are about $30$ major languages with more than a million speakers each. The country is divided into $35$ states, states are divided into $640$ districts and districts are divided into $5923$ sub-districts. Some sub-districts have only one community and have only $1$ language while the most heterogeneous sub-district has as many as $105$ languages.

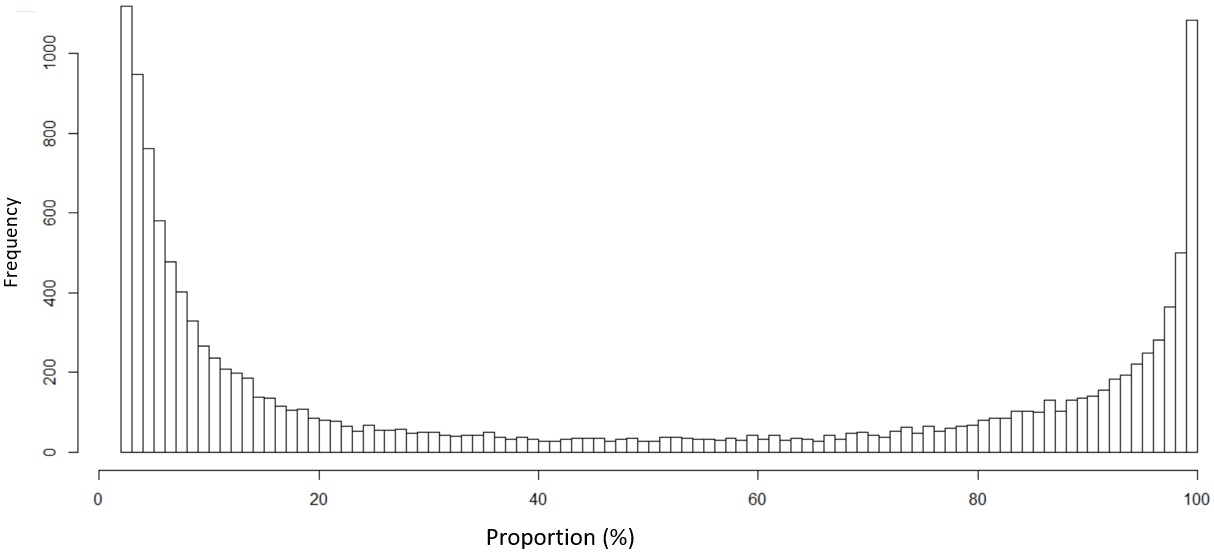
For each language which is spoken in sub-district, divide the number of native speakers of a language in a sub-district by the total population of the sub-district to get the proportion of native speakers of that language in that sub-district. When we do this for all sub-districts and language combinations, this gives us $105961$ data points. The histogram of the distribution of these proportions is shown below which resembles an arcsine distribution.

enter image description here

The same shape appears even if we plot of the larger states instead of the whole country. Similarly, even if we plot at a district level, the same arcsine like shape appears.

Question 1: Why do we have this distribution that roughly resembles an arcsine like distribution. Note that I am not saying that it is necessarily a perfect arcsine in the theoretical sense but rather in an engineering application sense where it is good enough to assume the nearest matching distribution in order get the job done. I know that random Brownian motion results in an arcsine distribution but I am not sure if that is the underlying reason here.

Question 2: What would be the best way to interpret this observation? For example does such a shape indicates that a few major/dominant language will eventually cannibalize the numerous minor languages?

$\endgroup$
5
  • $\begingroup$ Do you have 35 data points per sub-district (a proportion speaking that "major language" within that sub-district)? $\endgroup$ Commented May 31, 2020 at 5:45
  • $\begingroup$ We have a data point whenever a language has $\ge 1$ speaker in a sub-district. Some sub-districts have only one community and have only 1 language hence i.e. data point while the most heterogeneous sub-district has as many as 105 languages i.e. 105 data points. $\endgroup$
    – Stats IT
    Commented May 31, 2020 at 6:44
  • $\begingroup$ I can't follow what your graph is showing --- Frequency of what? Proportion of what out of what? $\endgroup$
    – Ben
    Commented May 31, 2020 at 10:44
  • $\begingroup$ @Ben-ReinstateMonica Divide the number of native speakers of a language in a sub-district by the total population of the sub-district to get the proportion of native speakers of that language in that sub-district. When we do this for all sub-districts and language combinations, this gives us 105961 data points. The histogram of the distribution of these proportions is shown $\endgroup$
    – Stats IT
    Commented May 31, 2020 at 11:38
  • $\begingroup$ Okay, so "proportion" refers to the proportion of native speakers of a language in a subdistrict. $\endgroup$
    – Ben
    Commented May 31, 2020 at 11:59

2 Answers 2

6
$\begingroup$

Question 2: What would be the best way to interpret this observation? For example does such a shape indicates that a few major/dominant language will eventually cannibalize the numerous minor languages?
How many subdistricts are there? It looks like in most districts (about 2 or 3 thousand?) one language is dominant with 80% or more of the people that have this as their native language (and high dominance seems to be more likely than little dominance)

As a consequence, this leaves only 20% for the other languages in a district, and that creates this mirrored image. A language is spoken either by many (scoring >80%) or (as a consequence) on the other side only by a few (scoring <20%).

(Possibly there might be some bilingual speakers, but I assume that in most cases the native speakers of languages should add up to more or less 100% in a single subdistrict.)


In short:

You don't see many languages in the middle around 50% because there is often a dominant language in a district, which causes bumps at the high end (representing the percentage of native speakers of the dominant language) but also a bump at the low end (representing the percentage of native speakers of the non-dominant languages).


A nice way to add information to that graph would be to make a stacked graph where you sub divide the bars and give different colours to the 1st most spoken language, the 2nd most spoken language, and the other languages. In that way you can see how the mirror image is created from on the right the dominant (most spoken) language. And on the left the rest.


Question 1: Why do we have this distribution that roughly resembles an arcsine like distribution. Note that I am not saying that it is necessarily a perfect arcsine in the theoretical sense but rather in an engineering application sense where it is good enough to assume the nearest matching distribution in order get the job done. I know that random Brownian motion results in an arcsine distribution but I am not sure if that is the underlying reason here.

I don't believe that it is so simple as 1d Brownian motion. But maybe it could be insightful to make some maps and see how the languages distribute.

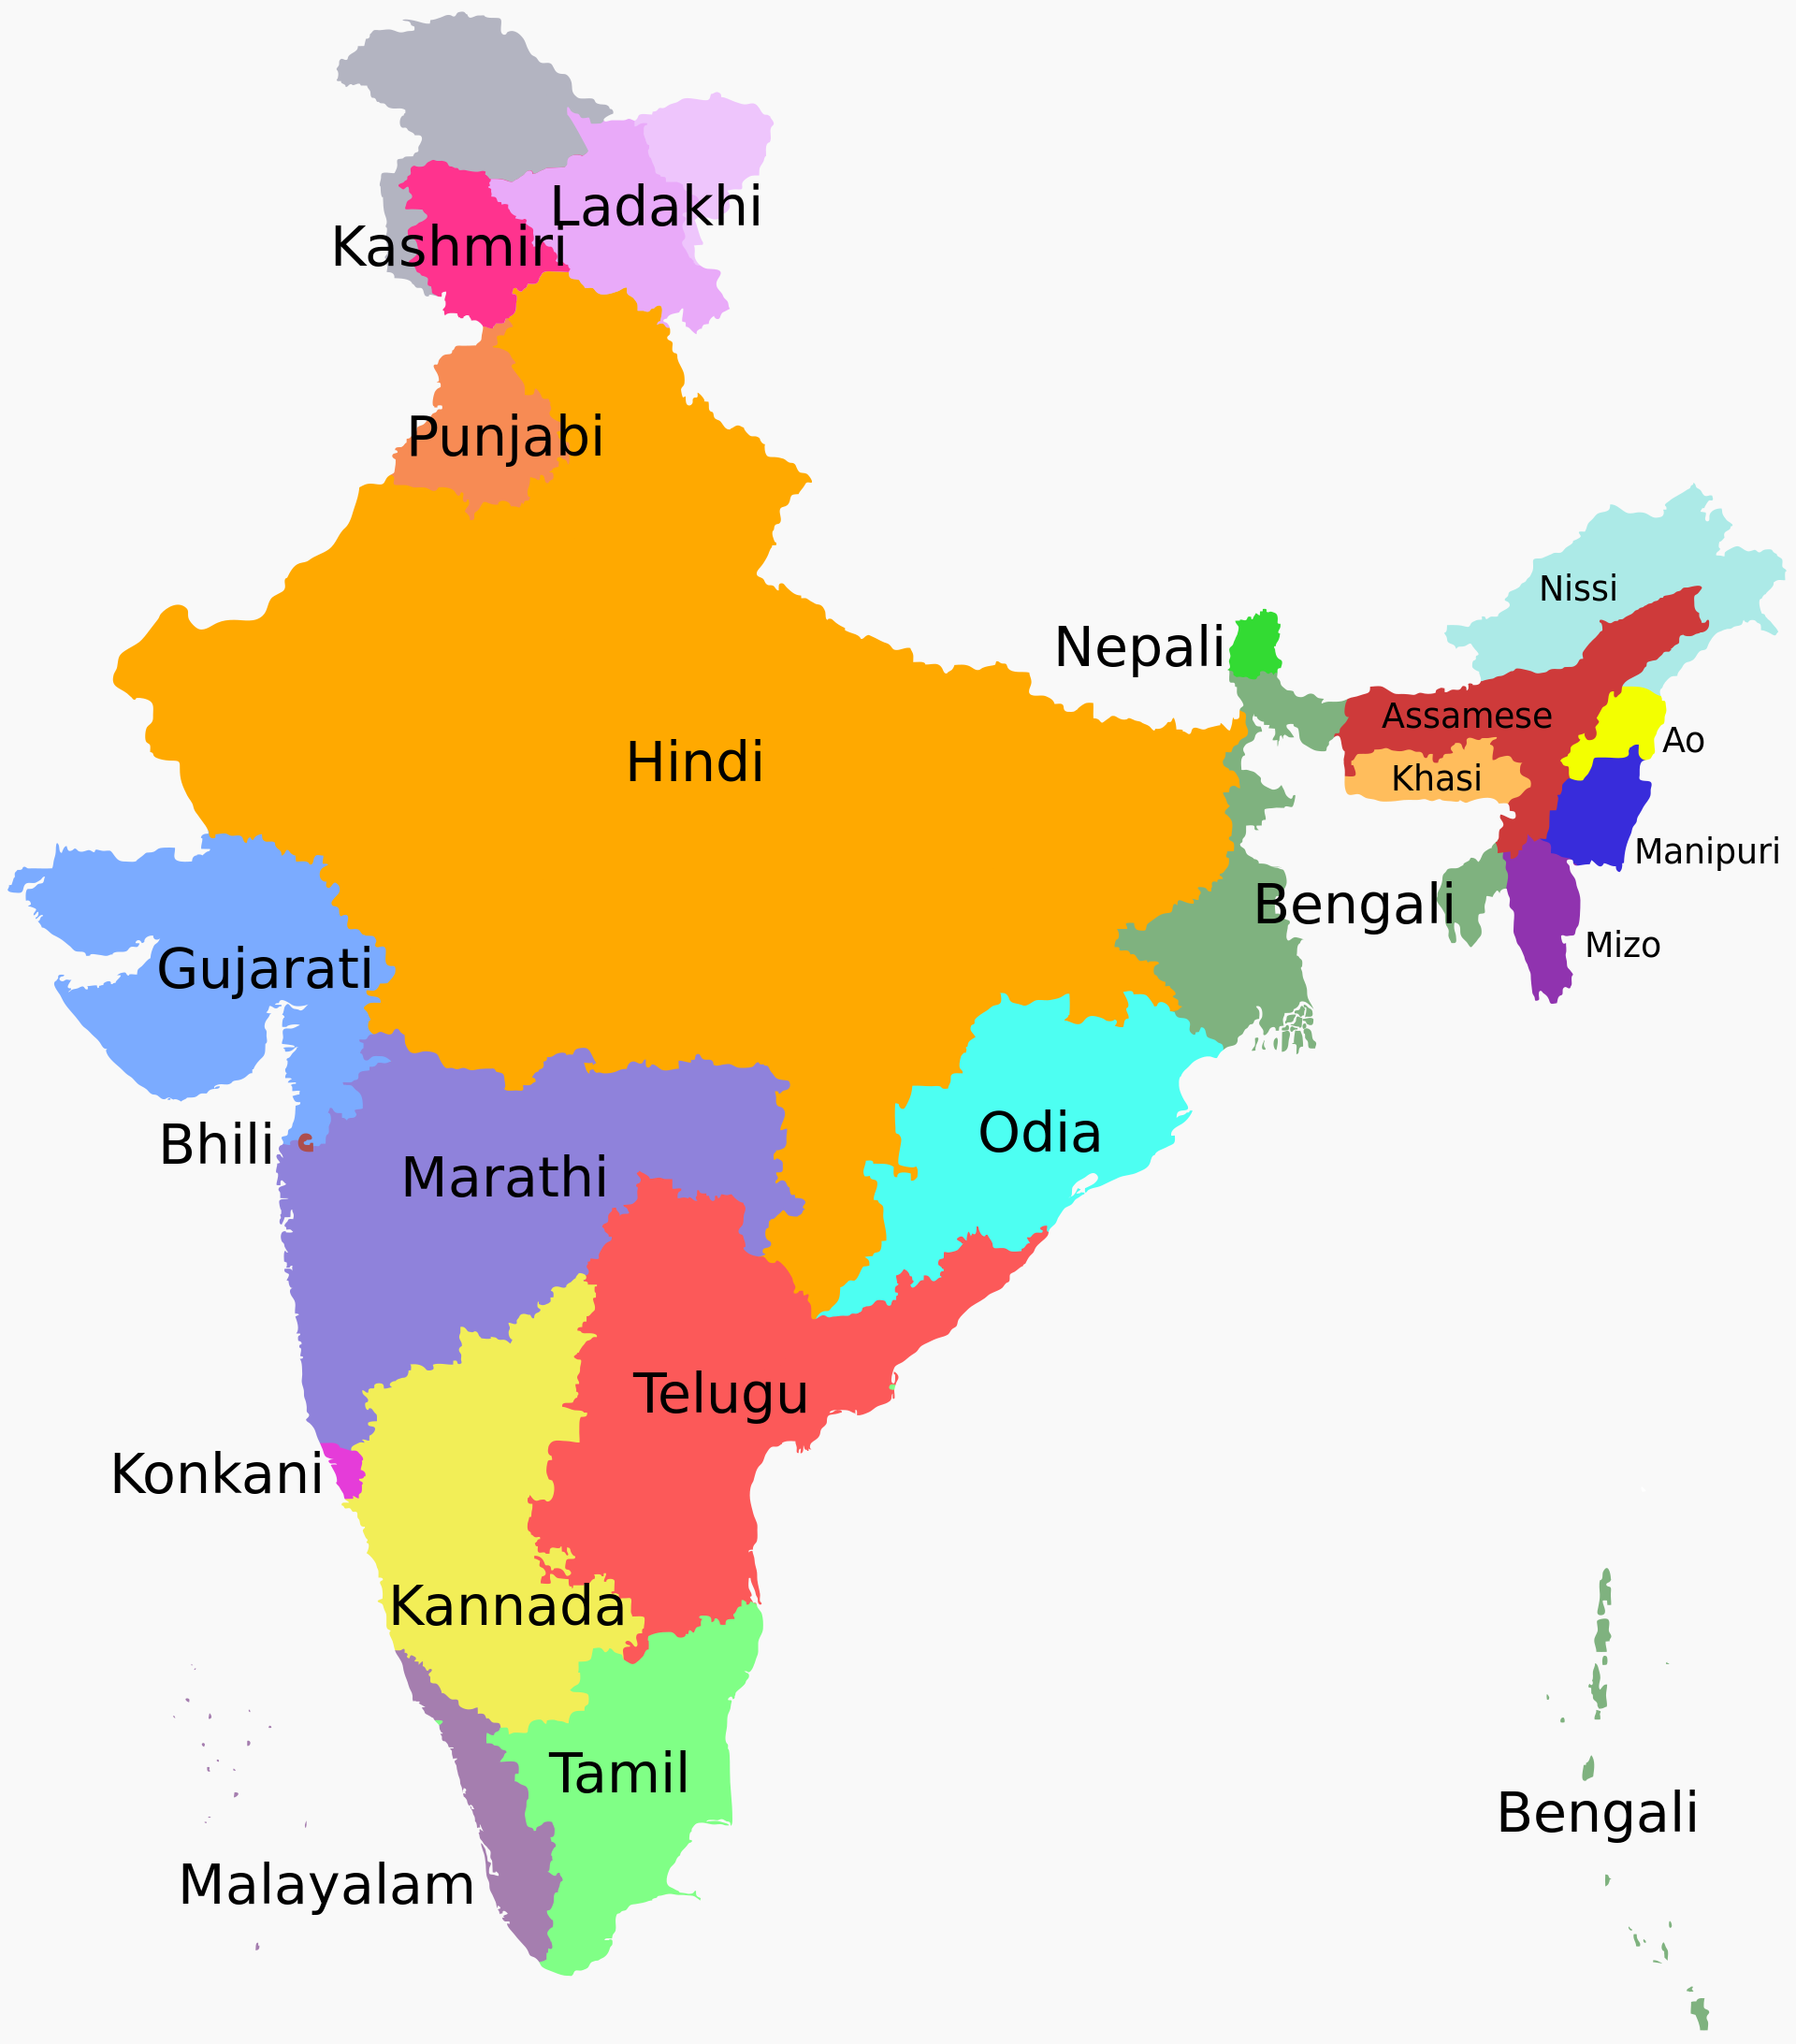
What I imagine is that the majority of the curve is dominated by the mayor languages which are concentrated in regions where they are the 1st language spoken:

From https://commons.m.wikimedia.org/wiki/File:Language_region_maps_of_India.svg#mw-jump-to-license 1st spoken language

and on top of that you can imagine some mixing of those languages at the borders which causes the distribution to deviate from a perfect 0/100% split.

You might see this spread as some sort of Brownian motion process (but possibly with some attractive forces). And the probability for languages to reach further from their origin reduces and in that way you get some distribution that might be simular to the arcsine distribution, but probably it will be more complex, maybe you could model(approximate) it more generally as a beta distribution, but possibly it is a mixture of something more complex, that happens to look like an arcsine.

$\endgroup$
14
  • $\begingroup$ My intuitive reasoning is exactly inline with your thoughts. There are distinct 5923 sub-districts. There is no bilingual because the census only counts 1 mother tongue per person. $\endgroup$
    – Stats IT
    Commented May 31, 2020 at 9:12
  • $\begingroup$ I wonder if we can have theoretical derivation or justification to show that under such scenarios, we will get an arcsine distribution like in the case of Brownian motion. $\endgroup$
    – Stats IT
    Commented May 31, 2020 at 9:14
  • $\begingroup$ @StatsIT How many points are there which have >50%. These can only be at most 5923 points right? Because there can never be two or more languages in a region that are simultaneously over 50%. Given that consideration, how can that curve represent 105k points if the right side, which looks almost half the points/weight represents at most 6k points (and might be less since the dominant language can be less than 50%). Could you provide more background about the data, or maybe the data itselve. Are most of those 105k points zero and not plotted? $\endgroup$ Commented May 31, 2020 at 12:28
  • $\begingroup$ Because there are 5923 sub-districts, but each one from this sub-districts can have between 1 and 105 languages to while one sub-district can have one data point for its only language, the next sub-district can give 105 data points, one for each of its language. $\endgroup$
    – Stats IT
    Commented May 31, 2020 at 12:48
  • $\begingroup$ @StatsIT but at most 5923 points can be on the right side of the graph not? I would expect the left sight to have more weight, unless the graph represents only 10/20k points. It seems like the zero (with 80k or more points) is not plotted. $\endgroup$ Commented May 31, 2020 at 12:55
1
$\begingroup$

The arcsine function describe a known distribution: the beta distribution $\mathcal{B}(\alpha = 1/2, \beta = 1/2)$. While a random walk would give a good mechanistic explanation, there is perhaps an answer in probability theory:

  • for any district the calculated proportion is a number between $0$ and $1$ - one can see it as the probability that the people from that district would speak its official native language,
  • when looking at the whole set of districts, this number can be considered as a random variable such that it is well described by the conjugate of the Bernouilli trial distribution, that is, the beta distribution,
  • this distribution has two parameters $\alpha$ and $\beta$.

Yet we need to understand why we should get $\alpha=1/2$ and $\beta =1/2$... Still half an answer: half full and half empty :-)

$\endgroup$

Your Answer

By clicking “Post Your Answer”, you agree to our terms of service and acknowledge you have read our privacy policy.

Not the answer you're looking for? Browse other questions tagged or ask your own question.