2
$\begingroup$

So whenever I learn about a method, or a technique to combat some disadvantage present in said method, some mention of transforming data into the Gaussian Distribution exists.

My focus here is mainly on Deep Learning.

For example, when it comes to C.N.Ns, standardizing our input data by subtracting the mean of your input examples by the std of the your input example, (which has the effect of transforming the input feature distributions into a unit gaussian) allows us to not only properly scale our input features but also make it resemble the Gaussian distributions...

(for reasons that are not apparent to me and which I intend to find out in the answers to this question)

Another example is a technique called batch normalization introduced to combat the effect of saturated neurons by being able to place the input value to subsequent layers in an "active" regime of the activation function as to continuously stimulate backprop & learning.

But the question remains.. why Unit Gaussian? Is it because it describes most phenomena out there to the degree that we just simply assume that the each feature (i.e. random variable) in our network should follow the normal distribution because that's the way of life? Or again, is there some underlying theory behind this?


EDIT1: Subtracting sample mean and dividing by std does not transform an existing distribution into a Gaussian D. but only applies some scaling and shifting characteristics to the distribution without changing its inherent shape.

$\endgroup$
7
  • 4
    $\begingroup$ Re "which has the effect of transforming the input feature distributions into a unit gaussian:" Certainly not. It only has the effect of changing their units of measurement. It does not change the shapes of their distributions. As such, your question is predicated on something that just isn't true -- not even approximately. In light of that, would you perhaps like to edit and refine it? $\endgroup$
    – whuber
    Commented Nov 23, 2020 at 16:28
  • 2
    $\begingroup$ Centering and scaling the data is not the same as transforming to a Gaussian distribution. The benefits of centering and scaling the data for machine learning are discussed in a number of places on stats.SE, such as stats.stackexchange.com/questions/421927/… It's not required or even recommended to have zero-mean/unit-variance data in all contexts; alternative centering and scaling methods can work well for idiosyncratic reasons. $\endgroup$
    – Sycorax
    Commented Nov 23, 2020 at 16:46
  • $\begingroup$ Interesting. Well now that we got that misunderstanding, or just out right false statement, out of the way, the question as to why is the Gauss. Dist. mentioned a lot in Deep learning still remains a mystery to me. It seems like i attributed the likes of batch normalization to a changing of the original distribution which i now know is false... $\endgroup$ Commented Nov 23, 2020 at 17:29
  • $\begingroup$ Still though, would you care to explain maybe in what context, surrounding DL, would you require or advise to have the data distribution looking like a gaussian distribution, and/or its usefulness? $\endgroup$ Commented Nov 23, 2020 at 17:30
  • 2
    $\begingroup$ There is a huge amount of misinformation out there concerning the desirability of Gaussian distributions. In most cases what one is interested in is achieving some approximately symmetric distribution, preferably without very long tails. That is far weaker than being approximately Gaussian, yet it simplifies the description, interpretation, and analysis of the data. Few statistical procedures require approximate Gaussian distributions of data and many are robust to substantial departures from the Gaussian shape, provided the symmetry/no long tail conditions are met. $\endgroup$
    – whuber
    Commented Nov 23, 2020 at 18:27

1 Answer 1

4
$\begingroup$

Building on whuber's comment, check out the following bit of Python code.

import numpy as np
import matplotlib.pyplot as plt
np.random.seed(2020)
x0 = np.random.normal(0, 1, 1000)
x1 = np.random.normal(11, 5, 1000)
x = np.concatenate([x0, x1])
plt.hist(x)
plt.show()

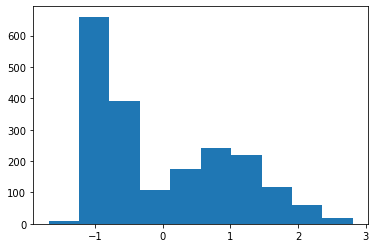
enter image description here

xbar = np.mean(x)
s = np.std(x, ddof=1)
plt.hist((x-xbar)/s)
plt.show()

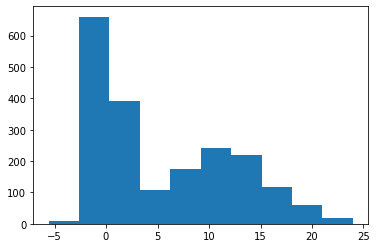
enter image description here

You'll notice that your x variable has a very non-Gaussian distribution. Upon subtracting the mean and then dividing by the standard deviation, you graph the same shape, so subtracting the mean and then dividing by the standard deviation does not give you a Gaussian distribution; you have the same kind of shape as you had before, just shifted and compressed (or expanded, if the original standard deviation is less than $1$).

You are correct that the mean of the transformed variable will be $0$ and the standard deviation will be $1$, however, so if your data started out Gaussian-looking, then it will be standard normal-looking after the transformation.

$\endgroup$
4
  • $\begingroup$ Great quick visualization, I appreciate it. Would you care to present some example surrounding the use of turning the data distribution into one resembling the gaussian distribution? As that is still a bit hazy to me. $\endgroup$ Commented Nov 23, 2020 at 17:31
  • $\begingroup$ @KamalRaydan Nothing about the z-score transformation (subtract $\bar{x}$, divide by $s$) turns the distribution into a Gaussian one, so I am not sure what you want me to do. $\endgroup$
    – Dave
    Commented Nov 23, 2020 at 17:39
  • $\begingroup$ Yea i'm currently passed that, now that we've gotten that misunderstanding out of the way. With regards to DL though, I've heard many references to having the data transformed to look more like a Unit Gaussian. The reason for this though isn't apparent to me. (Hence if you could provide the reasons where making the sample distribution "more normal" could be useful) $\endgroup$ Commented Nov 23, 2020 at 17:48
  • 2
    $\begingroup$ @KamalRaydan Please ask that in a separate question. In that post, please include references to where the unit Gaussian distribution is desired. There is a lot of tricky phrasing out there that makes for widespread misconceptions. $\endgroup$
    – Dave
    Commented Nov 23, 2020 at 17:51

Your Answer

By clicking “Post Your Answer”, you agree to our terms of service and acknowledge you have read our privacy policy.

Not the answer you're looking for? Browse other questions tagged or ask your own question.