2
$\begingroup$

Info:

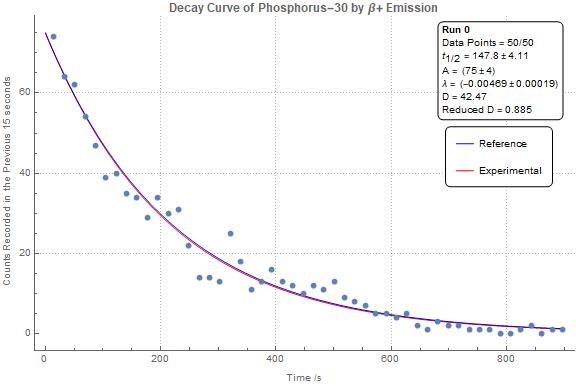
I have a data set of radioactive decays in 15s (to clarify, each point is just the number of counts in the last 15s, as opposed to the cumulative number of decays - since there is 3s of the detector not measuring after each 15s measurement).

The data set has 50 points, and the discreet counts measured range from 74 down to 0 (so quite low stats). (The half-life of the decay is about 150s)

Question:

  1. Should I / Is it valid to, use a poisson statistics to model the exponential decay, even with the relatively low counts?
  2. How would I calculate the uncertainty for the 'counts in the last 15 seconds' (values below) values? (Is still valid to just be using sqrt(N) valid, where N is the number of counts? (i.e. should the first point just be 74 +/- 9) - or do I need to make some alterations to the uncertainty calculation for the low stats?

Data Set: (If it helps for any reason)

74, 64, 62, 54, 47, 39, 40, 35, 34, 29, 34, 30, 31, 22, 14, 14, 13, 25, 18, 11, 13, 16, 13, 12, 10, 12, 11, 13, 9, 8, 7, 5, 5, 4, 5, 2, 1, 3, 2, 2, 1, 1, 1, 0, 0, 1, 2, 0, 1, 1

Graph:

Fit with Generalised Linear Model Fit with Poisson Exponential Family enter image description here
$\endgroup$

1 Answer 1

3
$\begingroup$

Of course, you start with Poisson distribution. It is a radioactive decay after all. The reasons not to use Poisson would be systematic errors due to equipment setup or something wrong with your experimental design.

If your equipment is setup properly then uncertainty due to measurement error should be $\pm 1$. What you refer to as $\sqrt N$ is the uncertainty coming from the radioactivity itself.

However, there is a twist: if the half life is short relative to 15s interval, then your counts should be exponentially decreasing, which they do in your data set. The model you want to estimate is $$N_i=A \exp(-\ln 2 \times 18/t_{1/2}\times i)+\varepsilon_i,$$ where $N_i$ - counts, $t_{1/2}$ - half life in seconds and $i$ - number of the observation. I assumed that with 3s mute, the time step is 18s. Here $\varepsilon_i$ - errors from Poisson distribution. The model ignores the decay of intensity within 15s interval of measurement, of course. The model can be properly estimated using GLM with Poisson and log link

I ran a simple nonlinear sum of squares optimization in Excel of the following equation: $\hat N_i= A \exp(-\ln 2 \times 18/t_{1/2}\times i)$, then SSE to minimize $(N_i-\hat N_i)^2/\hat N_i$. The parameter estimates are $A=75$ and half life $t_{1/2}=153$. The problem with this approach is that there is no measure of uncertainty around half life estimation, but it can be more intuitive to understand and the results agree with the GLM method.

$\endgroup$
10
  • $\begingroup$ I see, so uncertainty in a single measurement would be (Taking 74 as the example): 74 +/- 1. And the uncertainty in the counts per second would be 74 +/-Sqrt(74)/(15). Given that you mentioned it not meeting the requirements for a poisson distribution, is there a better way of fitting this you would recommend? The data set does show exponential decay. The half-life is 150s, the experiment is about 900s - would that be considered relatively short enough? My end goal is trying to fit the results validly, and find the half life and uncertainty to see if they agree with the 150s reference $\endgroup$
    – Epideme
    Commented Jun 1, 2021 at 14:42
  • 1
    $\begingroup$ yes 900s interval is very short relative to half life of 150s. I think in your case WLS should work fine when using $1/N$ as the weight $\endgroup$
    – Aksakal
    Commented Jun 1, 2021 at 14:45
  • 1
    $\begingroup$ ideally, you want to come up with MLE of Poisson distribution with decaying intensity. however, running a simple nonlinear regression on your data with $1/\hat N$ as weights, and assuming 18s intervals (with 3s mute) I get almost exactly 150s half life $\endgroup$
    – Aksakal
    Commented Jun 1, 2021 at 15:01
  • $\begingroup$ I see. I've added my graph which uses a Non-Linear Model Fit from Mathematica for Poisson distributions, but I'm not too sure what the fitting method is. I think it might be Least squares, but not certain. However there's no weighting applied, and I should probably add the +/- 1 on each point. I've just seen you've posted your result, so I'll change my question to do you think this seems valid $\endgroup$
    – Epideme
    Commented Jun 1, 2021 at 15:15
  • 1
    $\begingroup$ The weighting $\pm 1$ will not work for your case. however, your fitting routine already uses Poisson so you are good here. Yes, the output agrees with mine, of course. GLS with Poisson family means that it's all taken care of $\endgroup$
    – Aksakal
    Commented Jun 1, 2021 at 15:19

Your Answer

By clicking “Post Your Answer”, you agree to our terms of service and acknowledge you have read our privacy policy.

Not the answer you're looking for? Browse other questions tagged or ask your own question.