I'm fitting a linear mixed model by SAS. There are 596 sectors and 8489 subjects. (each sector contains 10~15 subjects). Each subject is measured at most 6 times, so the total number of observation is 50043. SAS code are as follows.
proc mixed data=work.dat2 covtest method=ml maxfunc=1000 ;
   class group_k sectorid childuid;
   model laz=group_k x1 x2 x4 x6 x1_k x2_k x4_k x6_k
             / solution cl outpm=out;
         random sectorid;
         repeated / subject=childuid type=cs ;
         run;
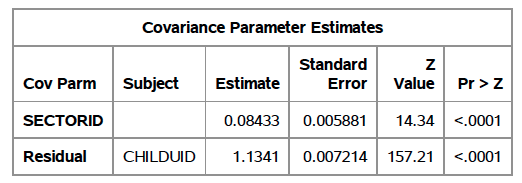
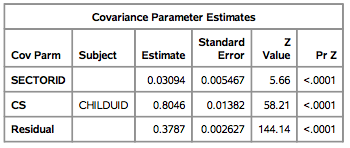
One of the result tables is as follows. The first table is without the option 'type=cs' (default type=VC), and the second table is with the option 'type=cs'.


I don't understand the relation between the SAS result table and the theory presented here http://support.sas.com/documentation/cdl/en/statug/63033/HTML/default/viewer.htm#statug_mixed_sect003.htm
The covariance matrix for the default 'variance component' is $ \sigma_k^2 1(i=j) $ and that for the type 'compound symmetry' is $ \sigma_1 + \sigma^2 1(i=j) $ In the two tables, I don't understand which corresponds to $ \sigma_k, \sigma_1, \sigma $ respectively.
