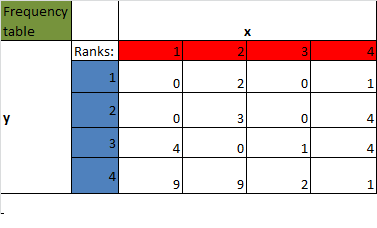
First time user here! I have some troubles in finding some statistic method that would fit my purpose for testing bivariate frequency table. Below is a sample frequency table I have created with ordinal data.

The rows and columns are labeled with ranks from 1 to 4. As you can see, most of my data is concentrated at the bottom-left corner for the sample. My goal is to quantitatively define this characteristic and perhaps perform a statistical test for estimating the dispersion in the population.
I have tried to the Chi-squared contingency table and Fisher's exact, but my table contains a few zeros cells.
Please advice any other appropriate test that I should attempt. Thank you.
ADDed: The experiment is designed as follow,
Four stocks are picked and their expected return and standard deviation are measured for 40 observations/periods. Within each observation, rankings are assigned to each stock for both y (expected return) and x (standard deviation) as 1 being the lowest and 4 being the highest. The frequency table above focuses on one of the four stocks.
if most of the observations fall into region of (y >= 3 & x <=2), I would characterize this stock as "low risk, high reward" option.
