7
$\begingroup$

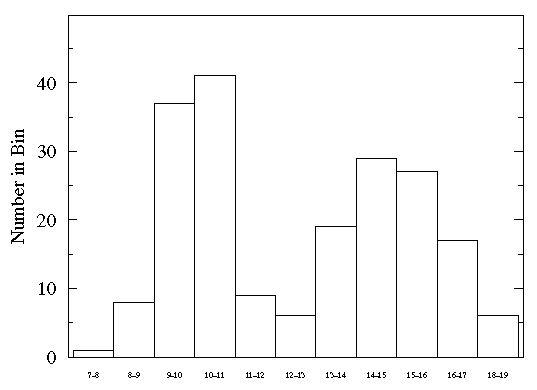
I know that a few people asked this question before and that clustering is not the best method for 1 dimensional data. However, I saw that in some published papers people used k-means clustering for 1 dimensional data. For example, data normally look like the graph below and ideally the algorithm should pick 2 clusters, according to which a separation value is determined (in this case it should be 12-13). Is it a good technique to use? What other methods could be used to identify the separation point for 2 clusters?

Thank you.

picture

$\endgroup$
1

2 Answers 2

3
$\begingroup$

K-means finds partitions in a single vector based on any heterogeneity in that vector. It won't automatically find two clusters unless you tell it to find two clusters out of the n possible clusters where n is the finite number of observations in your sample. It's only by generating up to n clusters and then using some sort of decision rule for cluster selection that you could arrive at two clusters.

There are literally dozens of unsupervised classification or clustering algorithms that would work with your example: hierarchical approaches, disjoint solutions, etc., should be at the top of the list. These methods are strewn throughout the literature but good inventories of the many nuances in approaching cluster analysis can be found in the big stat package documentation, e.g., the SPSS or SAS online manuals. That said, there are algorithms that definitely will not work, such as knn or any distance-based, similarity or dissimilarity technique which relies on a p dimensional space to define the solution.

If you have a target enabling a supervised approach, CART would be a good method for partitioning based on a single predictor.
$\endgroup$
0
$\begingroup$

K-means assigns objects to the nearest mean.

This makes sense mathematically as it minimizes the squared errors.

But if you look at your data set, the right gaussian has a larger variance than the left. Since k-means does not take this into account, the result will be suboptimal. GMM should work better on this particular data set, but so does manually choosing the threshold, or density estimation...

Why don't you just run k-means and visualize the results?

$\endgroup$

Your Answer

By clicking “Post Your Answer”, you agree to our terms of service and acknowledge you have read our privacy policy.

Not the answer you're looking for? Browse other questions tagged or ask your own question.