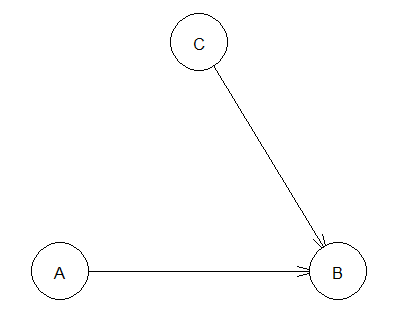
I understand d-separation and how v-structures in graphical models work. What i don't understand is how they relate to real world multivariate data. I don't see how v-structures can be separated from other junctions by looking at the data.
Take the following example

A: Studnet IQ, B: Test score, C: Test difficulty.
Student IQ cannot influence test difficulty, and vice-versa. But once the test result is known, learning either one allows us to make an educated guess about the other.
Say i obtain a data-set with student IQ, test-results and some measure of test-difficulty. How does the multivariate distribution in this dataset reflect the v-structure?
For my own understanding , i would like to generate two datasets (for example using R' MASS package and mvrnorm), one that would fit the v-structure model, and another where the arrow from C to B points the other way.
related question: Understanding d-separation theory in causal Bayesian networks
