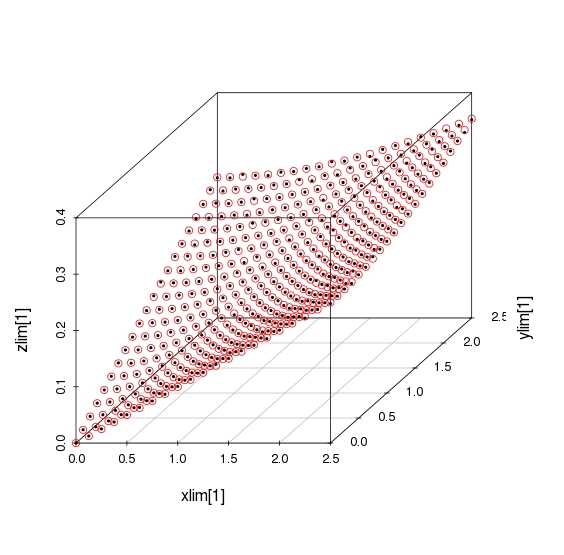
I want to fit my (x,y,z) data points to a function. You can see the data on Fig.1.
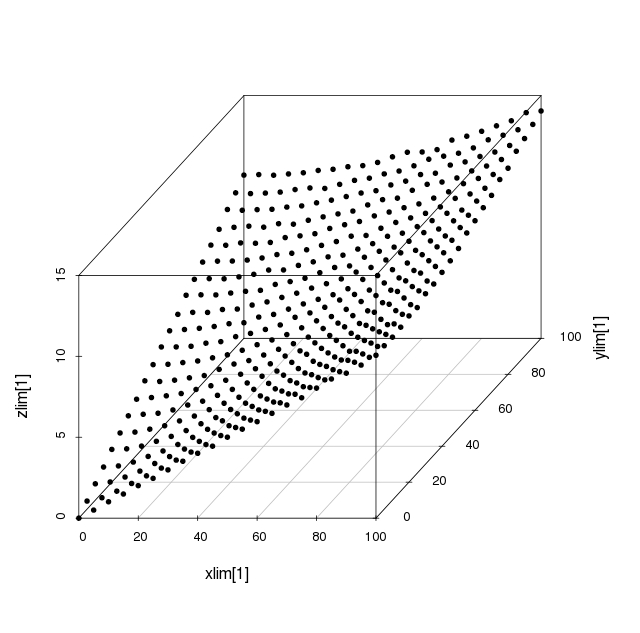
The data is symmetric along the main diagonal. To understand my data I have studied (y,z) curves at different values of x. I have made the following conclusions:
1. When x = 0 the (y,z) curve is a line $$z = k * y^1 + l$$
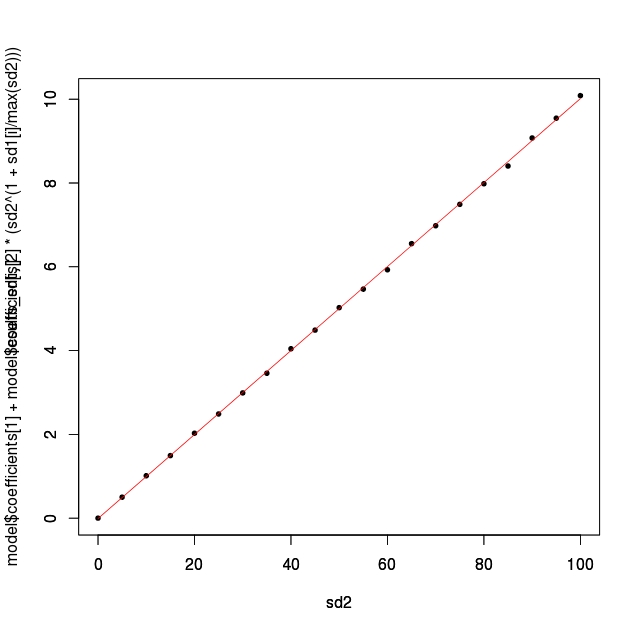
2. When x = max(x)/2 (in the middle) the (y,z) curve is polynomial of degree 1.5 $$z = k * y^{1.5} + l$$
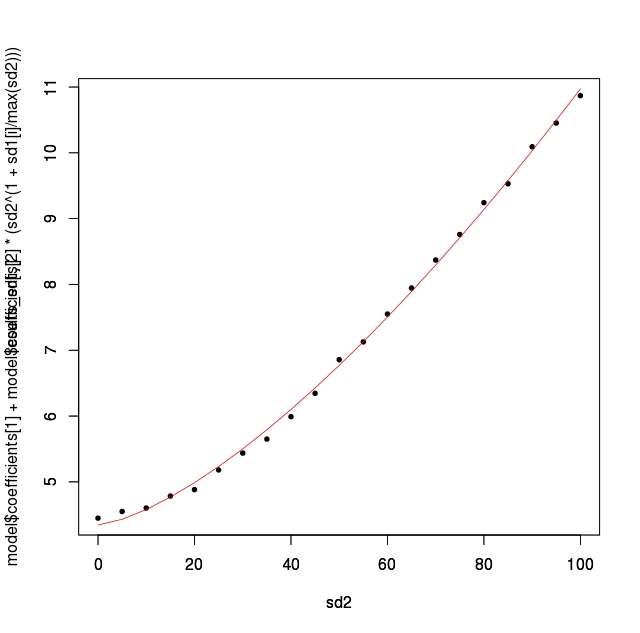
3. When x = max(x) the (y,z) curve is polynomial of degree 2 $$z = k * y^2 + l$$
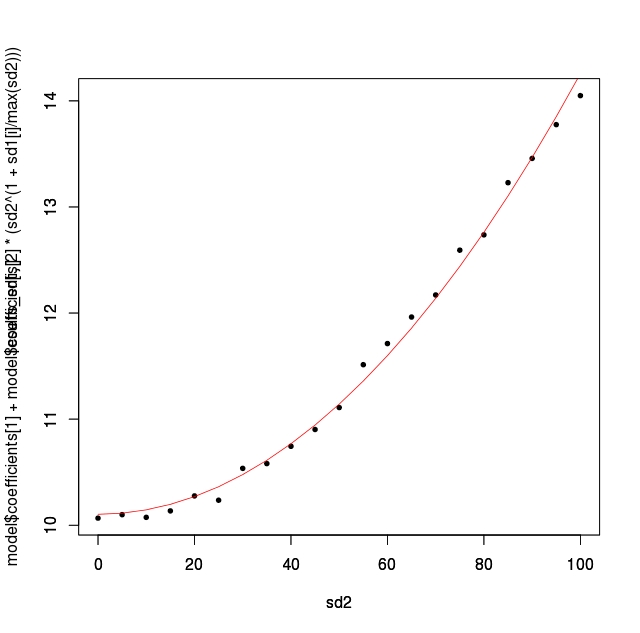
Therefore, each "cut" of my data can be explained using a polynomial function where the degree ranges from 1 to 2.
Still I have a problem fitting it all together using a bivariate function.
What I need is: $$z = func(x,y)$$
Could you suggest anything?

