2
$\begingroup$

I am trying to specify a model for split plot design that acknowledges nested sub-sampling. Split plot designs are a little bit tricky to analyze, and I am new to R, so I provide my dataset along with instructions at the bottom in case anyone can solve this challenge.

THE CONTEXT: In my MSc thesis, I am using a split plot design to test the effect of forest type ("Riparian" vs "sloped") and forest age (250 years/"old" vs 35 years/"young") on the biomass of salal, an understory plant of economic interest. The experimental design is similar to a two way factorial ANOVA. However, each old forest site is paired with a young forest site; before logging occurred they were within the same patch of forest or "historicstand". This pairing means that it is a split plot design (see figure). It took me some effort to learn how to analyze this split plot design, but now I understand it, and I can run this simple model fine in R base stats.

This model in R is:

aov(salalbio ~ foresttype + Error(historicstand/foresttype) + forestage+ forestage*foresttype, data = antfp)
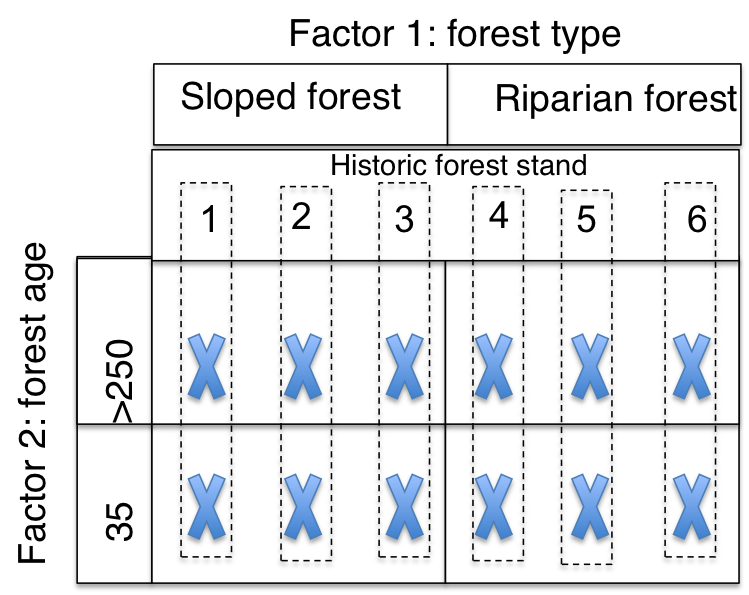
To conceptualize the experimental design, this shows the split plot layout. However, my challenge is that at each X there are two measures that are dependent THE CHALLENGE:The problem with the above model is that it does not recognize that within each site I have two measurements: At each site there are two sampling plots "sample_plots" where we measured salal biomass. These measurements are not replicates so I need to acknowledge that they are nested within site, or I risk a Type I error. How do I rewrite the model so that it acknowledges that sample plot is nested within Siteid? In base R[stats] would be easiest for me to comprehend, but any package would do.

fyi, I could just average the two measures by site and analyze it this way but my sample size is very small (n = 3 sites per each experimental level). When biomass is averaged I do not detect the effect. Analyzing the nested sub samples maybe, just maybe, will reveal an effect.

Here is the data:

saldata <- structure(list(Site.id = structure(c(1L, 1L, 4L, 4L, 2L, 2L, 
5L, 5L, 3L, 3L, 6L, 6L, 7L, 7L, 10L, 10L, 8L, 8L, 11L, 11L, 9L, 
9L, 12L, 12L), .Label = c("ABOG1", "ABOG3", "ABOG4", "ABSG1", 
"ABSG3", "ABSG4", "ROG1", "ROG2", "ROG3", "RSG1", "RSG2", "RSG3"
), class = "factor"), foresttype = structure(c(2L, 2L, 2L, 2L, 
2L, 2L, 2L, 2L, 2L, 2L, 2L, 2L, 1L, 1L, 1L, 1L, 1L, 1L, 1L, 1L, 
1L, 1L, 1L, 1L), .Label = c("riparian", "sloped"), class = "factor"), 
 forestage = structure(c(1L, 1L, 2L, 2L, 1L, 1L, 2L, 2L, 1L, 
1L, 2L, 2L, 1L, 1L, 2L, 2L, 1L, 1L, 2L, 2L, 1L, 1L, 2L, 2L
 ), .Label = c("old", "young"), class = "factor"), historicstand = c(1L, 
 1L, 1L, 1L, 2L, 2L, 2L, 2L, 3L, 3L, 3L, 3L, 4L, 4L, 4L, 4L, 
5L, 5L, 5L, 5L, 6L, 6L, 6L, 6L), sample_plot = structure(c(1L, 
  2L, 1L, 2L, 1L, 2L, 1L, 2L, 1L, 2L, 1L, 2L, 1L, 2L, 1L, 2L, 
 1L, 2L, 1L, 2L, 1L, 2L, 1L, 2L), .Label = c("a", "b"), class = "factor"), 
 salalbio = c(26.7, 177, 100, 210, 240, 296.7, 410, 71.7, 
 253.3, 256.7, 93.3, 233.3, 106.7, 36.7, 0, 0, 86.7, 0, 20, 
 0, 233.3, 206.7, 115, 0)), .Names = c("Site.id", "foresttype", 
 "forestage", "historicstand", "sample_plot", "salalbio"), class = "data.frame", row.names = c(NA, -24L))

The below model (for split plot) needs to be modified so that sample plot "a" and "b" are recognized as coming from the same Siteid:

M1 <- aov(salalbio ~ foresttype + Error(historicstand/foresttype) + forestage+ forestage*foresttype, data = saldata)
$\endgroup$
5
  • 1
    $\begingroup$ First, I think you should rethink your experimental design. What you are calling a split-plot design looks to me more like a split-block design. Besides that, I could not understand this challenge you exposed: what is the factor that makes the two measures in the same subplot not to be replicates? If it is another controlled factor it could be a split-split-plot design. But be careful, this design may underestimate the error, because of the lack of casualisation characteristic of split-blocks designs. $\endgroup$
    – Walter
    Commented Apr 13, 2015 at 1:56
  • $\begingroup$ @Walter the two measures within each site are not controlled factors. We have two measures from each forest site because it is standard practice to do so. Thus, I do not think it is split-split-plot design. I could add a map to the question if it helps clarify the experimental design? I am just reading into the difference between split-block and split-plot now. $\endgroup$
    – Ira S
    Commented Apr 13, 2015 at 2:55
  • $\begingroup$ I believe that this is split-plot design. It seems very similar to the example described by @suncoolsu in this question: stats.stackexchange.com/questions/13788/split-plot-in-r $\endgroup$
    – Ira S
    Commented Apr 13, 2015 at 13:28
  • 1
    $\begingroup$ If you look at that table in this link it will actually be a split-plot design. The main difference to your case is the spatial design: you have 'tracks', meaning there is no spatial randomization, which characterizes a split-block design. $\endgroup$
    – Walter
    Commented Apr 13, 2015 at 15:01
  • $\begingroup$ Thanks @Walter. I still need to read into this more, but do you know off hand, if/how this actually effects how I specify my model in R? $\endgroup$
    – Ira S
    Commented May 10, 2015 at 20:17

2 Answers 2

1
$\begingroup$

Ok, let's focus on some issues I can find here. As I already stated on the comments, the 'tracks' present in this arrangement characterize a split-block design with three replicates in each combination A x B. Pay attention to the term replicate, I will go back to it later. So, if you want to analyze your experiment in R, assuming you have a balanced data set (this is important too), the model should be:

anova(lm(var ~ Block + type + Block/type + age + Block/age + type:age, data=dt.sb))

Fine. Problem solved, let's discuss it, right? Wrong! This arrangement is valid if the whole blocks are repeated. So, you should have at least three sets of that combination type X age to use this design. If you consider each of the replicates (remember I said I would go back to it) within the combinations as a repetition, you might be falling into the pseudo-repetition problem, besides the fact it does not meet the requirements for the model described above.

Also be aware you have three residuals in this analyses, and by consequence three coefficients of variation. This experimental design is not very encouraged because of its lack of randomization and the pseudo-repetition problem is very likely to be pointed out as an important issue.

$\endgroup$
3
  • $\begingroup$ What is casualization? $\endgroup$ Commented Dec 9, 2018 at 7:12
  • $\begingroup$ That's the process of making something random $\endgroup$
    – Walter
    Commented Dec 10, 2018 at 11:39
  • $\begingroup$ Then, is it any different form randomization? $\endgroup$ Commented Dec 10, 2018 at 12:00
0
$\begingroup$

The repeated measures within the subplot turn this into a nested design. See pg 181 of the following for clarification on what sets it apart from a split plot (in a nutshell; split-plot is a generalization of RCBD) or repeated measures

http://halweb.uc3m.es/esp/Personal/personas/jmmarin/esp/Disenno/CursoDisExpSAS.pdf

....I think the defining difference between this situation and repeated measures is that it has three factors making it more than a simple repeated design experiment (which as far as I can tell has a limit of two factors).

....so it is a sort of hybrid of split plot (generalized RCBD) and repeated measures.

This link gives an example of a a three factor nested design;

http://staff.utar.edu.my/limsk/Consultancy/Nested%20Factorial%20Design.pdf

$\endgroup$

Your Answer

By clicking “Post Your Answer”, you agree to our terms of service and acknowledge you have read our privacy policy.

Not the answer you're looking for? Browse other questions tagged or ask your own question.