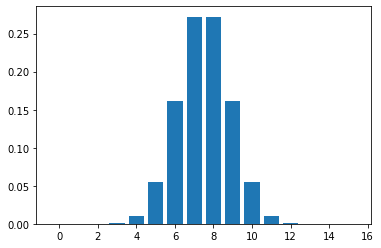
I commented above asking if someone knows how to do a convolution in closed form. Based on @Glen_b's comment about doing it computationally, I figured I'd add an example in Python in case it is helpful.
from scipy.stats import hypergeom
import numpy as np
import matplotlib.pyplot as plt

def distr_of_indep_xsum(x1, x2, p1, p2, trim=False):
    # calculate probablities of sums of x1, x2 happening independently
    mx = x1.max() + x2.max()
    # consider values from 0 to mx so can just use index
    xvals = np.arange(mx + 1)
    pvals = np.zeros(mx + 1)
    for xx1, pp1 in zip(x1, p1):
        for xx2, pp2, in zip(x2, p2):
            xsum = xx1 + xx2
            # independent probabilities are multiplied
            pvals[xsum] += (pp1*pp2)
    if trim:
        max_nonzero = np.where(pvals > 0)[0].max()
        xvals = xvals[:(max_nonzero+1)]
        pvals = pvals[:(max_nonzero+1)]


    return xvals, pvals / pvals.sum()


def hgprobs(ndraws,  nitems, nitems_same):
    # note: the notation in the function differs from that in wikipedia, so I am making [![enter image description here][1]][1]it clearer
    x = np.array(list(range(0, ndraws + 1))).astype(int)

    p = np.array([hypergeom.pmf(xx, nitems, nitems_same, ndraws) for xx in x])

    return x, p

def hypergeometric_convolution():
    # two hypergeometric variables
    x1, p1 = hgprobs(ndraws=3,  nitems=10, nitems_same=5)
    x2, p2 = hgprobs(ndraws=12,  nitems=20, nitems_same=10)
    xsum, psum = distr_of_indep_xsum(x1=x1, x2=x2, p1=p1, p2=p2)
    plt.bar(xsum, psum)
    plt.show()

hypergeometric_convolution()


