0
$\begingroup$

Imagine I have a distribution like the following
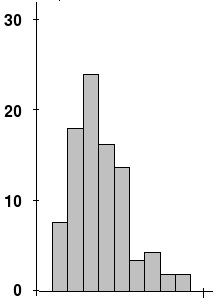
enter image description here

File SkewedDistribution.png of Wikimedia Commons by User:Audriusa licensed under CC-BY-SA 3.0

Now I want to measure, how this distribution differs from being normally distributed. What can I do?

My attempt: I cannot use the skewness because this only measures the symmetry of my distribution. Another way would be to calculate $\inf_{N\in\mathcal N} d(X,N)$ whereby $\mathcal N$ is the set of all normal distributions (i.e. the set of all distributions with density function $\frac{1}{\sigma\sqrt{2\pi} } \; e^{ -\frac{(x-\mu)^2}{2\sigma^2} }$) and $d$ is a metric for distributions. Is this a good choice for measuring the difference of being normally distributed?

$\endgroup$
6
  • $\begingroup$ In complement of the skewness, you can also measure the kurtosis en.wikipedia.org/wiki/Kurtosis $\endgroup$
    – brumar
    Commented Jun 20, 2015 at 21:28
  • 1
    $\begingroup$ What metric to choose depends on the purpose of the comparison. Why are you comparing this distribution to normality? $\endgroup$
    – whuber
    Commented Jun 20, 2015 at 21:55
  • $\begingroup$ @whuber: I analyze the distribution in a way which is only defined for normal distributions. To reason, why this is okay, I need to measure the difference to being normally distributed... $\endgroup$ Commented Jun 20, 2015 at 22:09
  • $\begingroup$ How will some arbitrary measure of non-normality tell you the extent to which the analysis is still reasonable? The measure and the analysis may not respond in the same way to the particular kind of non-normality you have. More details may lead to better advice. $\endgroup$
    – Glen_b
    Commented Jun 21, 2015 at 3:47
  • $\begingroup$ You can consider use K-S Test. $\endgroup$ Commented Jun 21, 2015 at 5:22

1 Answer 1

2
$\begingroup$

Start with a Normal probability plot https://en.wikipedia.org/wiki/Normal_probability_plot . The tails are where non-Normaility can be most extreme. If the probability calculations you are going to make on the distribution are roughly in the "middle" of the distribution, as opposed to the tails, you can get away with a lot. But if you're trying to do risk analysis, say, and need to understand the probability (risk) of an extreme outcome, the tails of the distribution (and one of those tails in particular) is all that matters, and that is where non-Normality (effect on probability calculation results) is usually by far the most extreme. Aside from being perhaps non-symmetric, most real-world distributions have much fatter tails than a Normal, no matter what variance or standard deviation is used, and therefore use of a Normal distribution often vastly understates the true probability of tail events (more than 2 or 3 standard deviations from the mean). Of course, dependence vs. independence across random variables or events can also be a huge driving factor in what the actual probability of an extreme event is.

So, along the same lines as whuber's comment, you have to base your assessment of closeness to Normality on why you care how close the distribution is to being Normally distributed and what you're going to do with the distribution.

$\endgroup$

Your Answer

By clicking “Post Your Answer”, you agree to our terms of service and acknowledge you have read our privacy policy.

Not the answer you're looking for? Browse other questions tagged or ask your own question.