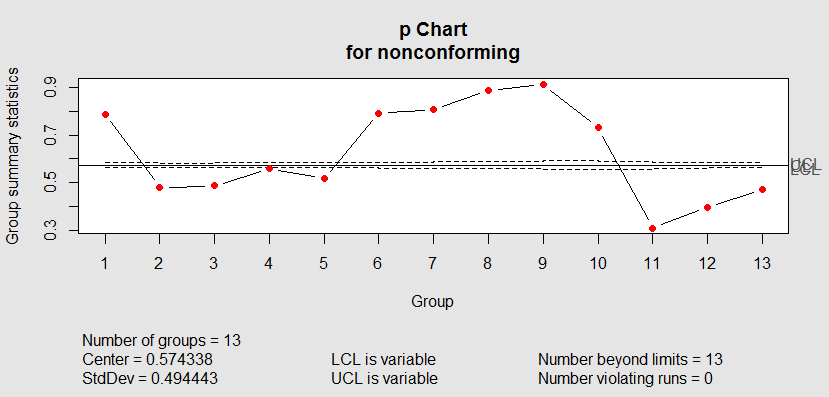
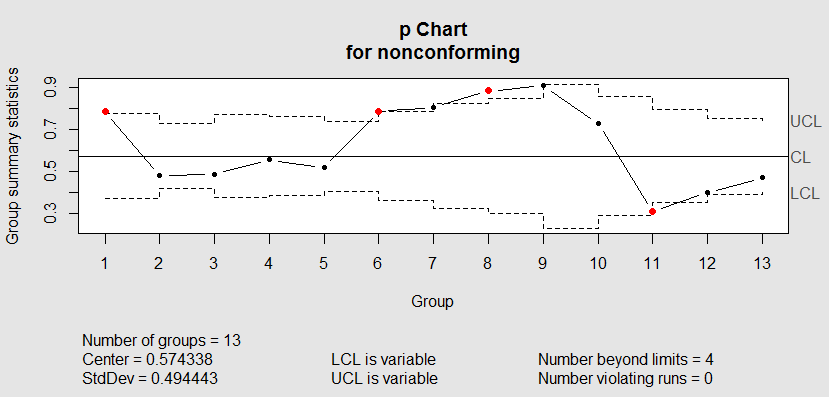
I have created a process control chart that describes the fraction of deliveries sent to the ideal destination over time. The deliveries all eventually end up at the proper destination, however I am trying to track the fraction that get to the ideal destination directly (no stops along the way). Here is the R code to reproduce a similar p-chart
library(qcc)
nonconforming <- c(12673,13311,8271,10554,12531,11623,
               8458,7852,5149,5964,4206,8035,10636)
sizes <- c(16114,27604,16956,18896,24138,14725,
       10483,8870,5654,8176,13476,20094,22467)
qcc(nonconforming, sizes=sizes, type="p")

The sample size is the whole population over a fixed period of time.
My question is, should I expand the width of the control limits so that more of the points plot in control? With this process I would have to expand the nsigma to a very large number to get about 3/4 of the points to fall withing the control limits
qcc(nonconforming, sizes=sizes, type="p", nsigmas = 52)

Or is it not even worth adding control limits to the chart until the process comes into control?
