2
$\begingroup$

I have X | Y1 | Y2 data, that I fit with some model. The model produces two values for one independent variable, where one is compared with the Y1 values, and the other is compared with the Y2 data.

To be clear: I am fitting all data at the same time, meaning I find the best parameters for the model, that describe both Y1 and Y2 as a function of X with the least overall sum of squares.

The fit works well, and now I want to calculate the R² value for the results. When I use Origin to do the fit, I get some value for R², but I have no idea how this is calculated.

I think that this is not the multiple regression case, because I have only one dependent variable. I understand how to calculate the R² value for the case where I have a single independent variable.

For example which average do I need when I build the sum? Do I use multiple average values (one for each independent variable), or do I average all Y values together?

As you may have guessed from my vocabulary, I am not very well versed in statistics, so a more Layman term description would be really great.


Edit: Here is some example data:

X   Y1  Y2
1   2   1
2   6   7
3   8   9
4   6   5
5   10  12
6   23  18

A dummy model (my actual model is more complex) would be:

Y1 = A * X + B
Y2 = (A/2) * X + B

Fit results I get with Origin are:
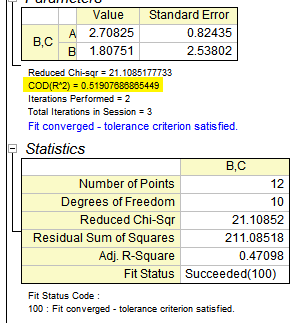
enter image description here

$\endgroup$
6
  • $\begingroup$ I thought R^2 was computed using the squared error vs. the mean compared to the squared error vs. the fit. If you know the error from the fit then it shouldn't matter if your domain is univariate or multivariate. Is that right? $\endgroup$ Commented Jul 7, 2015 at 16:47
  • $\begingroup$ As far as I understand it, it's sum of squared residuals vs. sum of squared differences between mean and data. But, for example, do I have to calculate separate means for each Y value, or a combined one... I am a bit confused, and I guess a simple example would make it quite clear how to do it. I was unfortunately unable to find one, since most search results deal with mutiple regression $\endgroup$
    – Jens
    Commented Jul 7, 2015 at 17:09
  • $\begingroup$ can you give a few rows of dummy data? I can then try to make an answer that speaks to it. $\endgroup$ Commented Jul 7, 2015 at 17:30
  • $\begingroup$ Sure, please give me a few minutes $\endgroup$
    – Jens
    Commented Jul 7, 2015 at 17:31
  • $\begingroup$ Do you prefer "R" (code and plot) answer or "Excel" (screenshot) answer? $\endgroup$ Commented Jul 7, 2015 at 17:33

1 Answer 1

2
$\begingroup$

This is a first attempt at an answer.

Source
I used your data for X, Y1, and Y2.

X   Y1  Y2
1   2   1
2   6   7
3   8   9
4   6   5
5   10  12
6   23  18

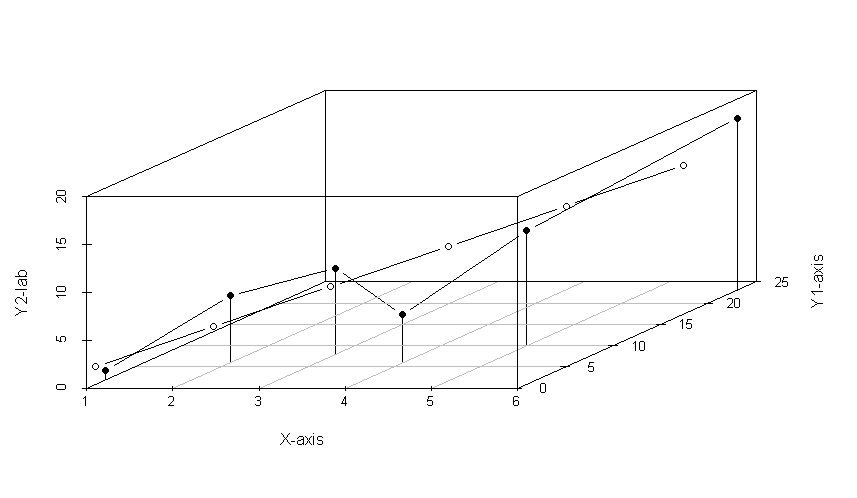
There is a 1:1 relationship here. A particular value of X, gives particular values of Y1 and Y2. The Y values can be thought of as a single point located in a 2d space. $Y=\left[ y_1,y_2 \right]$

Procedure:

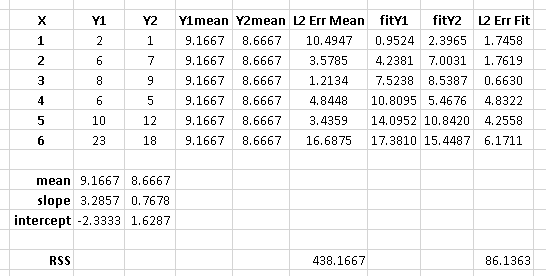
  1. enter the data into excel (excuse any typos)
  2. compute the mean, slope, and intercept using normal methods
  3. compute error between mean and actual for each row
  4. compute error between linear fit and actual for each row
  5. compute sum of squares for the mean-error column
  6. compute sum of squares for the line-error column
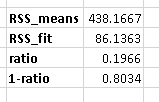
  7. compute the ratio of the sums in steps 5 and 6
  8. subtract that value from 1, and compare to the provided R^2

Results from approach is shown here:

enter image description here

Compute of ratio for RSS shown here:

enter image description here

Graph of data shown here (yes, y1 label is poorly placed): enter image description here

If you have a column of error, and a mean value of the target, then you can compute a Pearson R^2 statistic.

Some relevant references:

$\endgroup$
6
  • $\begingroup$ Thank you very much for the work you have put into this answer. I may however have been unclear in my question. My fit takes all data in at the same time. It's basically a problem of 1 independent and two dependent variables. This is why my Origin output shows 12 data points and comes to a different result as yours. It's a great example for calculating R² in the 1 dependent / 1 independent variable case though. Sorry if I did not make myself clear in the first place $\endgroup$
    – Jens
    Commented Jul 7, 2015 at 18:26
  • $\begingroup$ So your output is multivariate and parametric? I can update this, but not today... my evening is booked. $\endgroup$ Commented Jul 7, 2015 at 18:47
  • $\begingroup$ Well, maybe ;-) I fit both Y1 and Y2 at the same time, so that the overall sum of squares = Sum_over_i((y1_i,Data - y1_i,Model(x_i))^2 + (y2_i,Data - y2_i,Model(x_i))^2) is minimized, by adjusting A and B. This may be what you meant. Thank you, have a great evening! $\endgroup$
    – Jens
    Commented Jul 7, 2015 at 18:52
  • $\begingroup$ Hello, I have looked into this some more as well. Once you have the done the coupled fit (like in the results posted in the question) you need to average each Y-column seperately (like you have done), divide the overall sum of squares by the sum of squared differences between each Y value (of both columns) and their respective average. Subtract from 1 and you get the R². I think you difference is in how you calculate the sum of squares, since you calculate slope and intercept separately in two linear fits, even though they need to be coupled (note (A/2) for Y2). Thank you for the edits! $\endgroup$
    – Jens
    Commented Jul 10, 2015 at 15:58
  • $\begingroup$ Actually, now I had in this approach a small deviation from the Origin result. As I found out, Origin does not use separate averages after all, but the combined average over all Y values (Y1 and Y2) and then just calculates R² as normal. However I don't know if that is indeed correct. $\endgroup$
    – Jens
    Commented Jul 10, 2015 at 16:59

Your Answer

By clicking “Post Your Answer”, you agree to our terms of service and acknowledge you have read our privacy policy.

Not the answer you're looking for? Browse other questions tagged or ask your own question.